Today is the last day of week. This week is 6th green week. Bitcoin price went up at the last day of week and turned weekly candle to green. It may be a bullish trap on Bitcoin price chart. Market maker likes making fake moves.
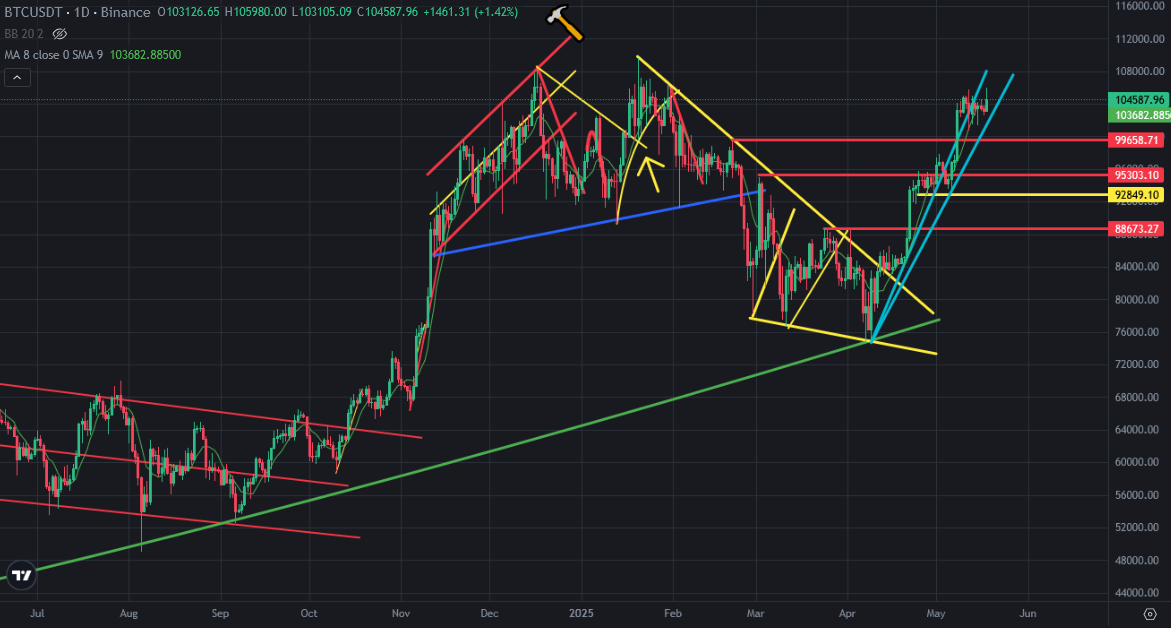
Here you can see weekly chart of Bitcoin. It is going to with vertical support line. Bitcoin price chart did not make any price correction while going up from 76K to 105K. Today It touched 106K. It was close to all time high.
Here you can see the indicators on daily chart of Bitcoin. MACD Indicator reversed down from the top. It is trying to reverse up again. Fisher Indicator reversed from the top. It is also trying to reverse up. I think It may be hard to reverse up again in this level.
There was great bowl pattern on Bitcoin price chart and It is broken down. It is time to see negative divergences on Bitcoin price chart after this move and We may see price drop on Bitcoin price chart.
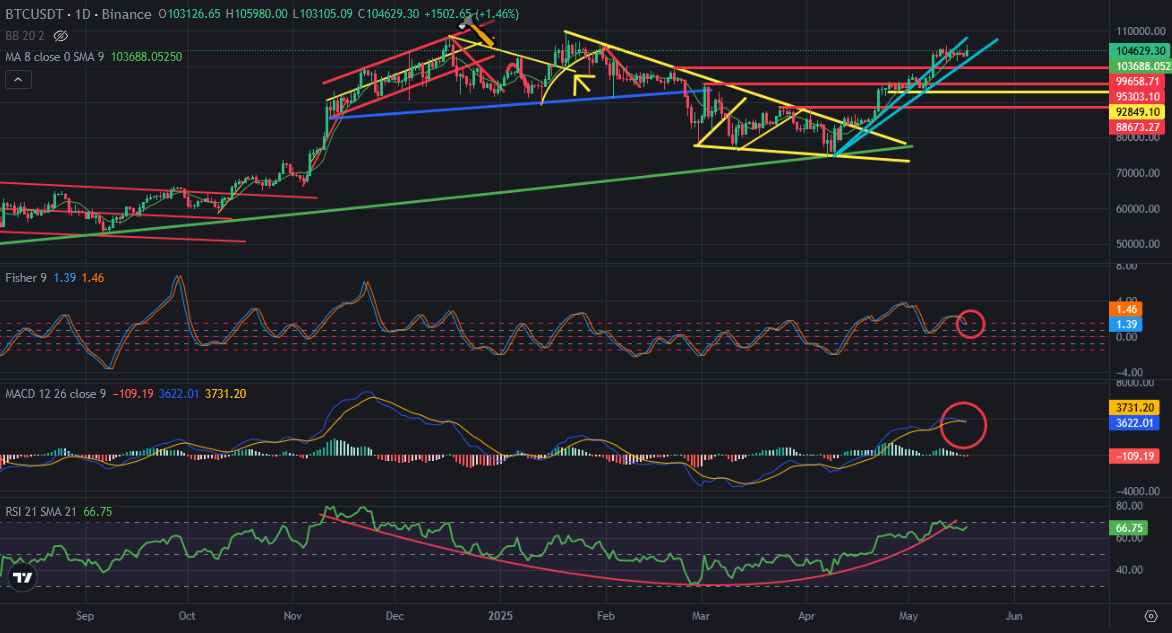
I think It was only a bullish trap of market maker. We are close to end of green candle series on weekly chart of Bitcoin. When we see red candle on daily chart of Bitcoin, we will see negative divergence on RSI Indicator. There are me reasons that I am waiting price drop on Bitcoin price chart.
We will see..