Bitcoin price is under downtrend pressure of downtrend line coming from 72K. Today bitcoin tried to break up this line but It could not break up. It may be early to see breaking up.
Here you can see daily chart of Bitcoin. There was uptrend line and Bitcoin broke down this line. You can see what happened after breaking down.
There is downtrend line and Bitcoin is trying to break up. When will we see brealing up of this line?
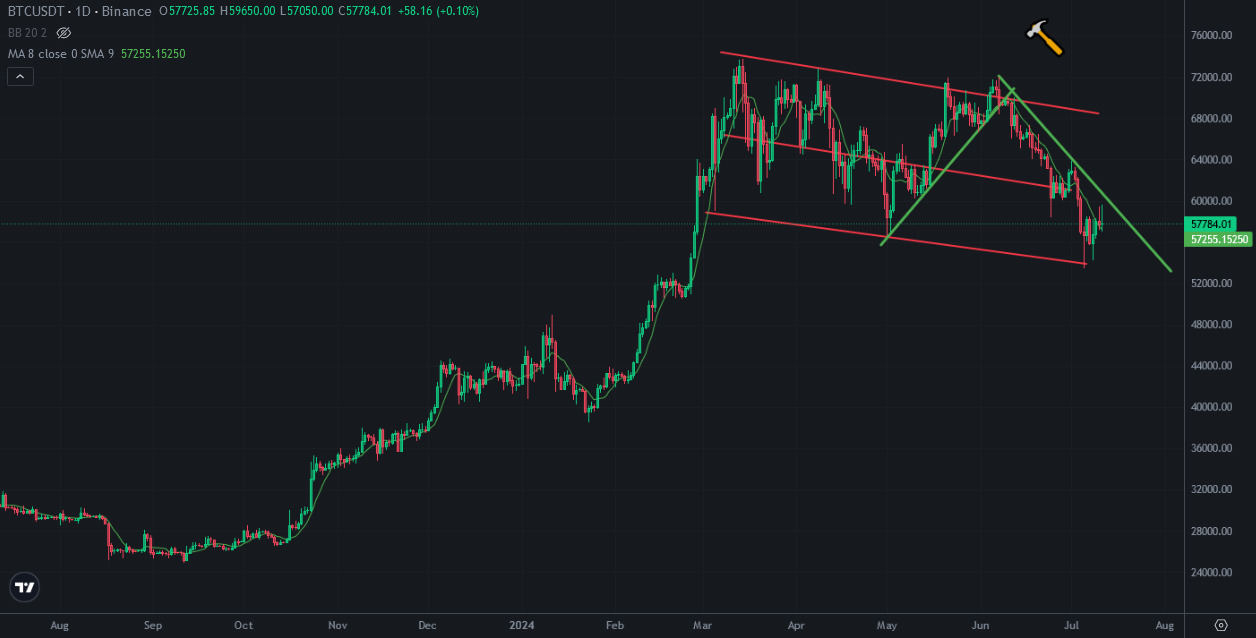
Here you can see weekly chart of Bitcoin. There was uptrend line on RSI Indicator. Uptrend pattern is broken down. If Bitcoin price breaks up downtrend line on daily chart, we may not see all time high. We may see lower high on Bitcoin price chart. It may be the middle line of descending channel. 60K is great resistance for Bitcoin price. It may be hard to break up!
MACD Indicator is also on downtrend. Fisher Indicator has a few weeks to reverse from the bottom. We may see this downtrend for a few months.
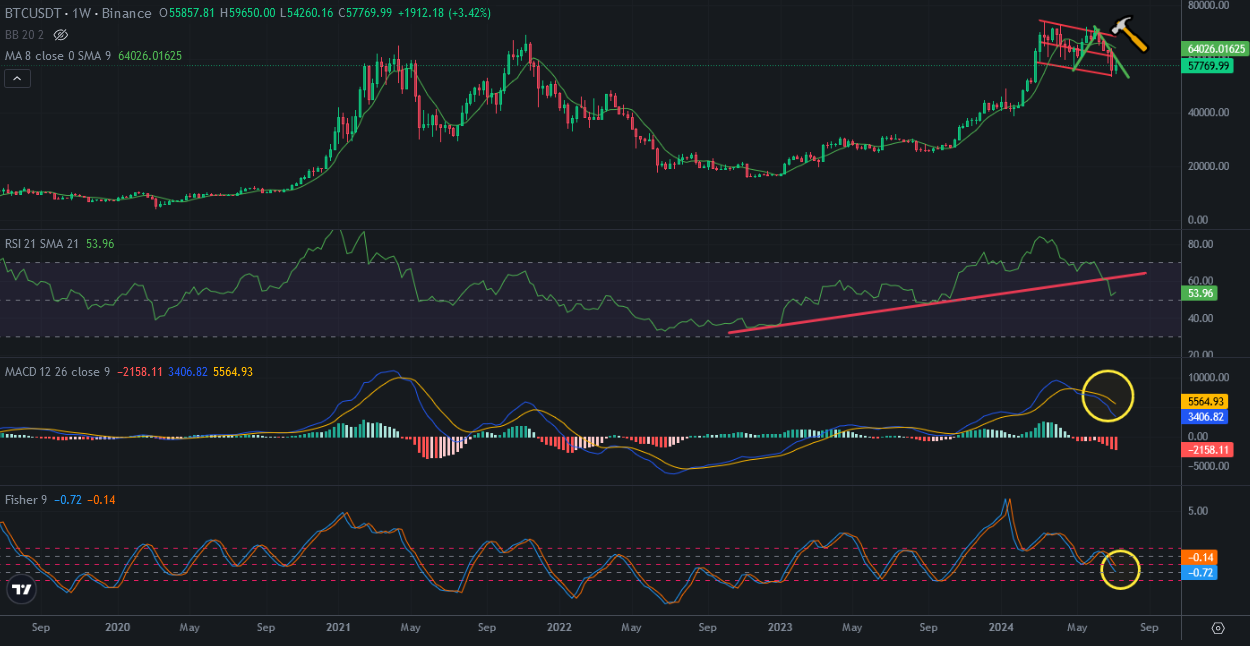
Crash has not begun. We may see a crash before altcoin season as 2020. Most of market players think that Bitcoin price may reverse from these levels. Market maker may make a crash to pick up discounted cryptos.
We will see…