There are a few proof of price correction appeared on Bitcoin price chart. I shared a few post about price correction coming soon. We saw a few proof of this possible price correction today.
Bitcoin and all crypto market may enter price coorection in this month. I may take more than a few weeks.
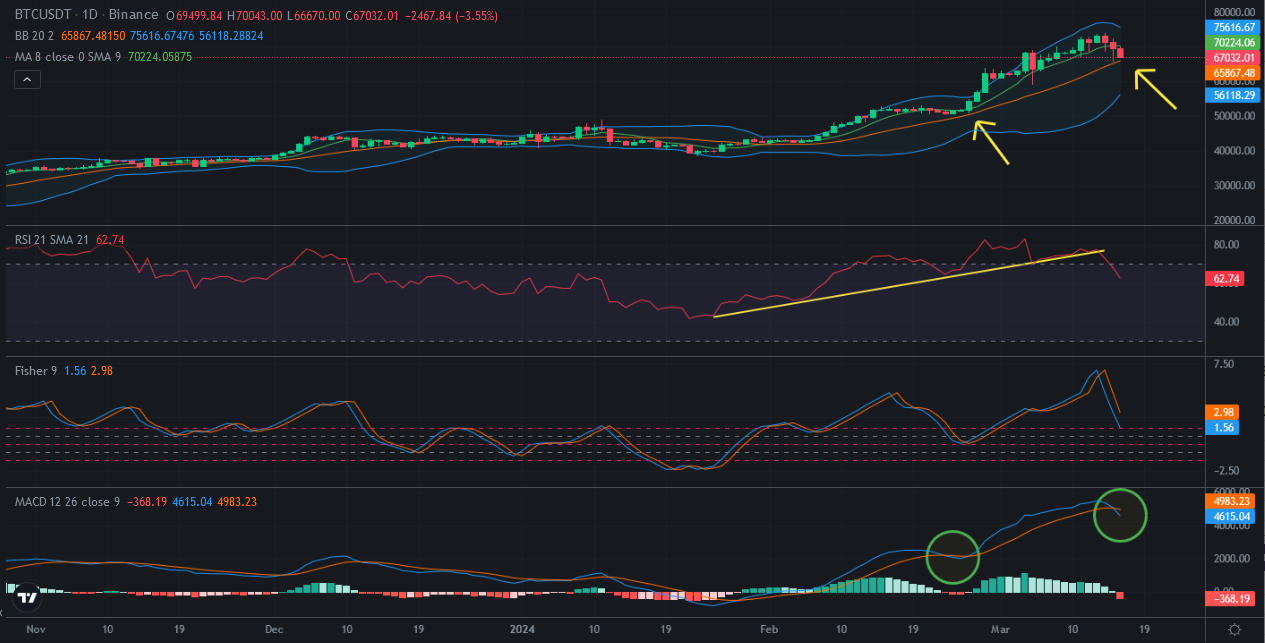
Here you can see daily chart of Bitcoin. Bitcoin broke down the support line of RSI Indicator. MACD Indicator is also reversed from the top! It means Indicators entered correction. When we look at Bitcoin price chart, Bitcoin support the middle line of Bollinger Band. If it breaks down, we can say that Bitcoin entered price correction.
Indicators are entered correction. We are waiting for Bitcoin price. If it enters, we can be sure that we entered price correction!
As I said, price correction may take a few weeks or months. Here you can see weekly chart of Bitcoin and Indicators are on the top. They will reverse and enter correction.
RSI Indicator is also in overbought level. Fisher Indicator is at level to reverse. That is why I say It may take a few weeks.

Meme hype is end of bullish season. We proved that today. After BOME releases, Bitcoin and crypto market went down.
I am waiting for price correction.
We will see…