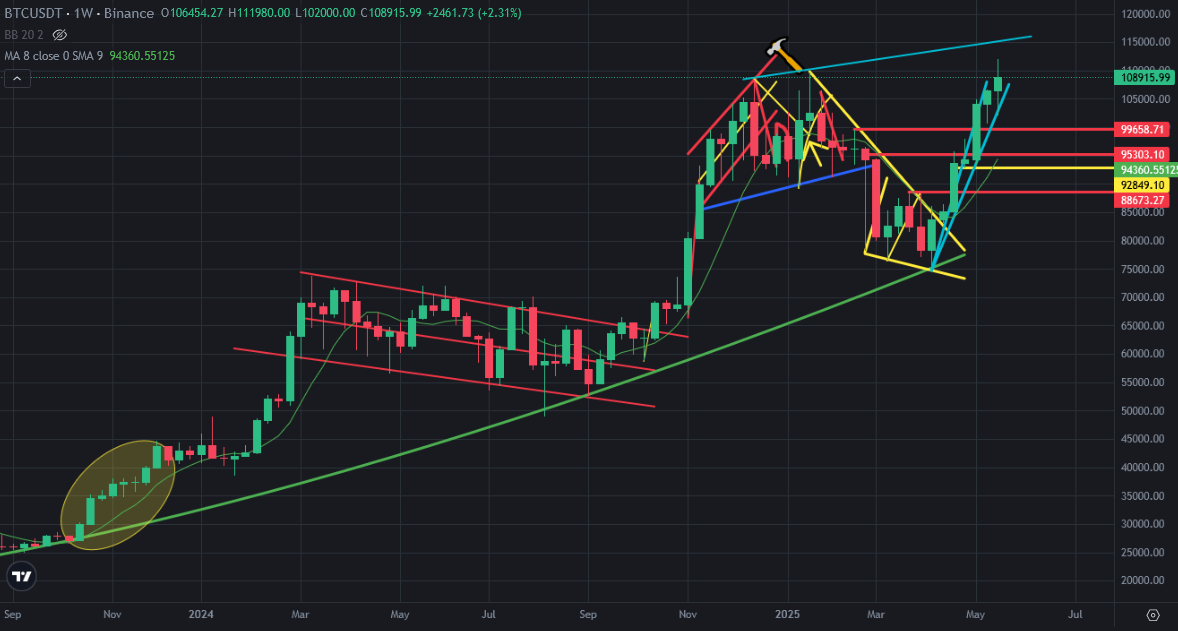
This is 7th week of Bitcoin price chart has green candles. We have seen these weekly candles series at the end of 2023. We are close to see red weekly candle on Bitcoin price chart.
Here you can see weekly chart of Bitcoin. We have seen 8 green weekly candles 1,5 years ago. Bitcoin is trying to continue green weekly candle series but there is great resistance on Bitcoin price chart at 115K USD where is line coming from the top of Bitcoin in 2025.
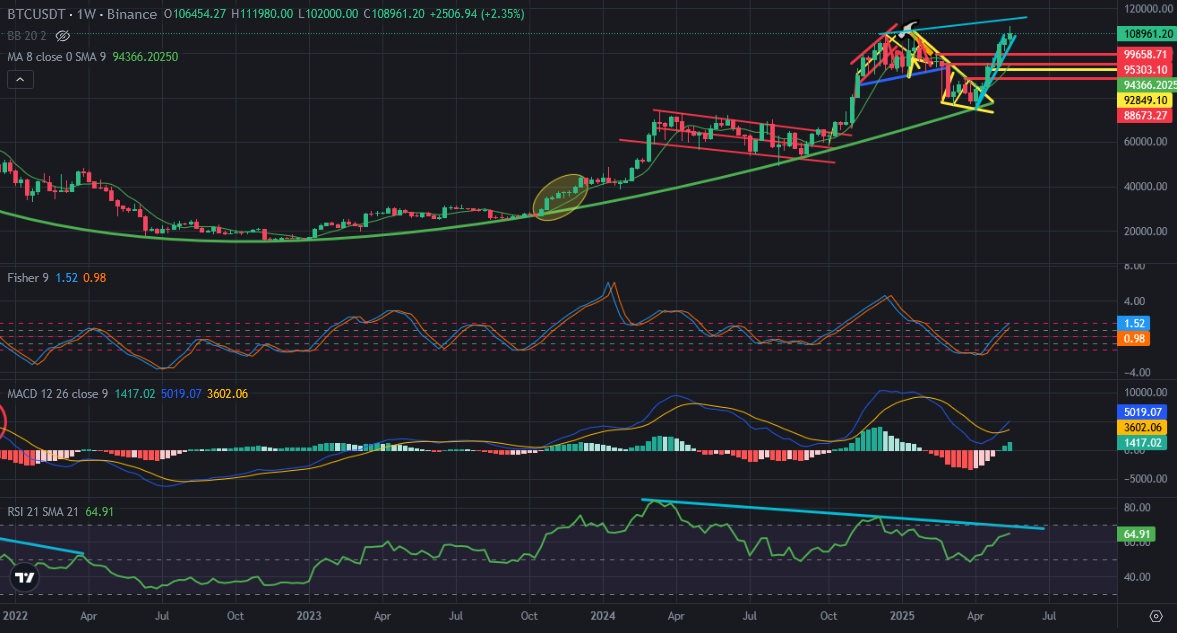
Here you can see the indicators on weekly chart of Bitcoin. There is negative divergence on RSI Indicator. Even the top of RSI Indicator is decreasing, the top of Bitcoin price is increasing. Fisher Indicator is close to reach the top. After reaching the top we will see reversing down in this indicator.
Market maker always do fake moves. We may see another one.
We are getting closer to see red weekly candle. I was thinking about red weekly candle in this week but market maker touched the price all time high. We may see it in next week.
We will see..