All of stock markets are down today. The new market crash came. Bitcoin price wend down from 70K to 49K in short time. I shared lots of analysis and said I was waiting for this price dump. It happened.
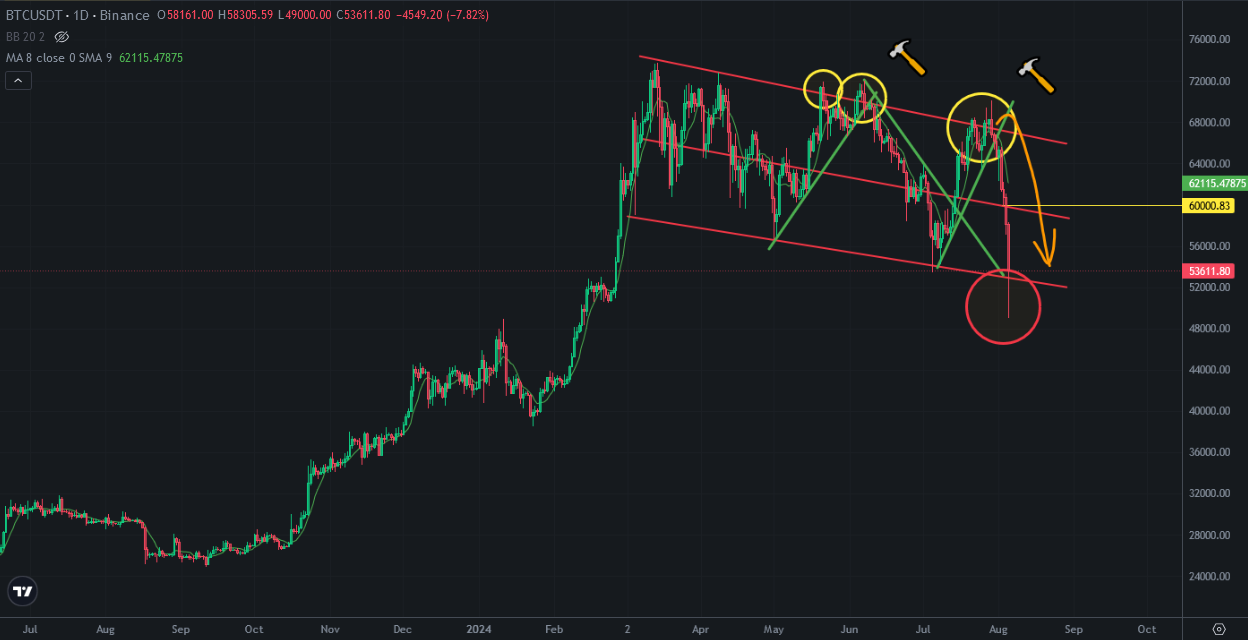
Bitcoin price was in descending channel. The bottom line of descending channel is great support for Bitcoin price. I don't think that Bitcoin will break down this support line.
Here you can see daily chart of Bitcoin and my draft. I showed you bullish traps on Bitcoin price chart. Today Even Bitcoin price broke down the bottom line of descending channel, Bitcoin price went up support line. It may be a bearish trap!
I think that It will be hard to see daily close below this support line. So, It may be great level to pick up crypto!
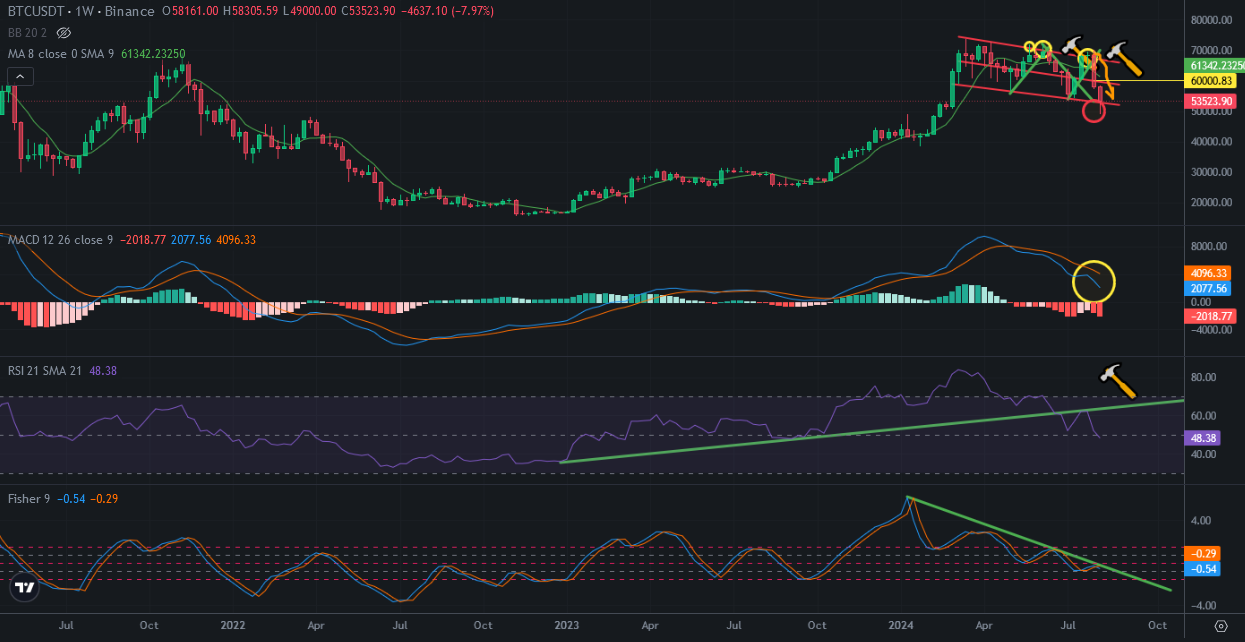
Here you can see weekly chart of Bitcoin. Fisher Indicator reverse from the top after touching downtrend line. We may see reversing of Bitcoin price from the bottom. We may never see Bitcoin price at these levels.
Bitcoin price will enter bullish trend until October. Downtrend line of Fisher Indicator will be broken up in a few weeks.
I am getting bullish after today. I started to flow cas to market to pick up discounted crypto. I should not miss this chance..
We will see..