This is 5th Week of red candles on Bitcoin price chart. Is Bitcoin in bullish trend? It is normal to see these red candles on Bullish Season?
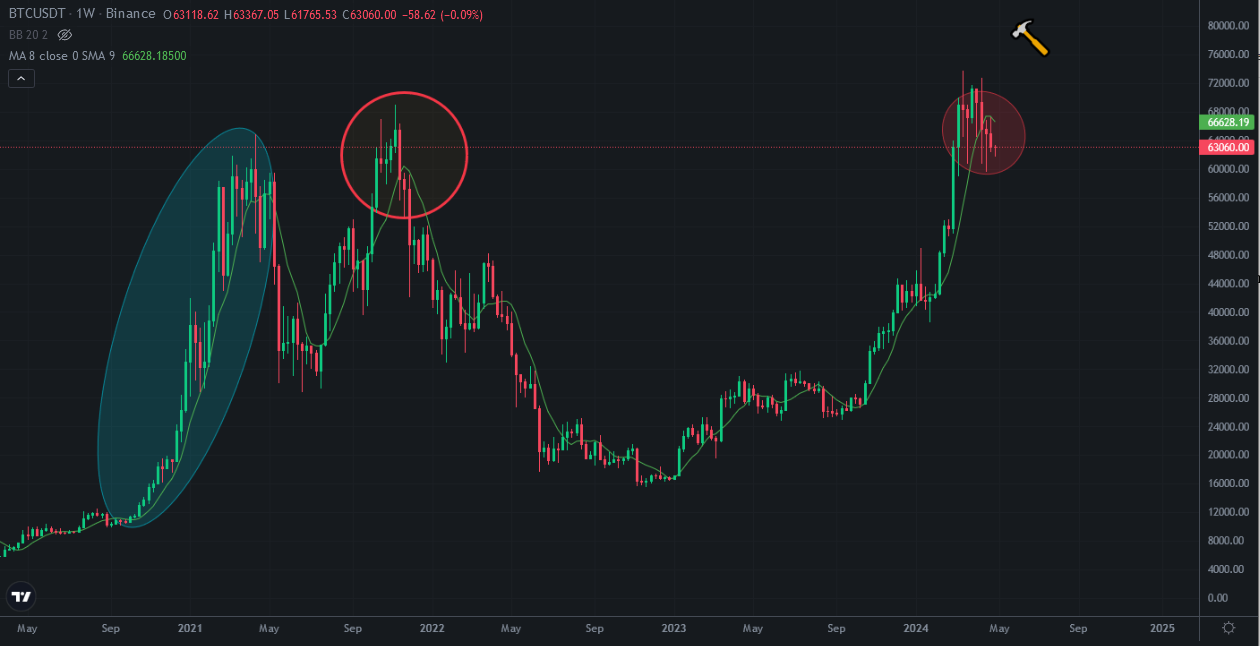
I think It is not. It is not good to see these red candles on Bitcoin price chart. Bitcoin went up in last 7 months without any price correction. This is why we saw these 5 red weekly candles on Bitcoin price chart. Even we saw 5 weekly red candles on Bitcoin price chart, Bitcoin went down only from 74K to 62K..
Here you can see weekly chart of Bitcoin. This is 3rd week that Bitcoin price is at below 8-week moving average.. This is the proof of returning of trend. We will see midterm price correction on Bitcoin price chart..
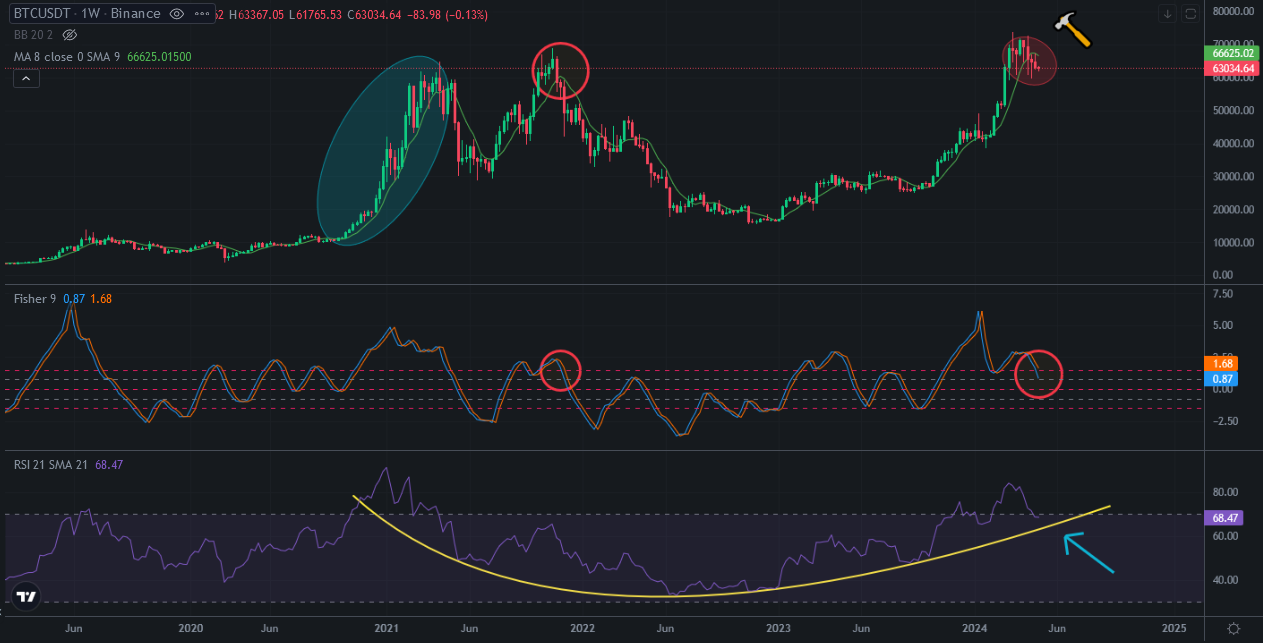
When we look at the indicator os Bitcoin price chart, we can see bowl pattern on RSI Indiator. That show us of ending of bullish trend. Bitcoin may touch this support line on RSI Indicator and continue to go up. But it need a few weeks to touch this support line. Bitcoin should go down to 52K to touch this target..
We are only at the beginning of price correction. There are lots of bearish charts on altcoins. Big price correction is coming soon before bullish season.
We will see..