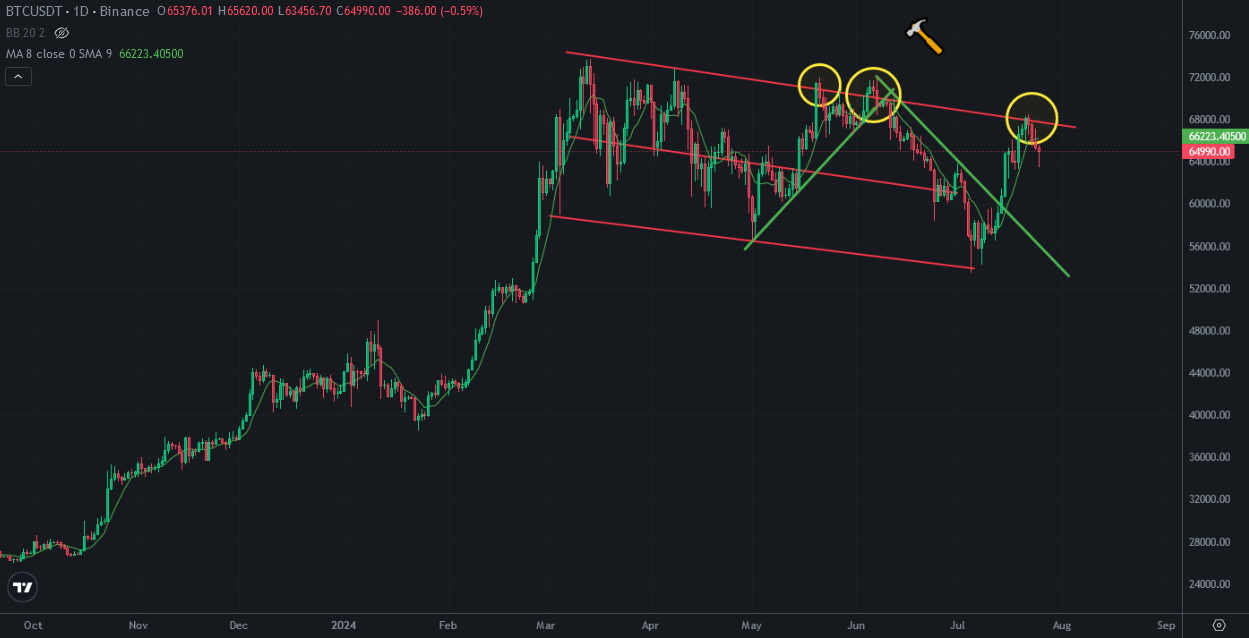
This is 3rd bullish trap that seemed on Bitcoin price chart. Bitcoin price went up from 54K to 68K and made 3rd bullish trap for bullish investors. They were waiting for new all time high and 100K but they trapped again..
Here you can see daily chart of Bitcoin. There is descending channel on Bitcoin price chart.
After toucgin the top line of descending channel, Bitcoin price went down. This is 3rd day after touching top line of descending channel and This is 3rd red daily candle.
After breaking up green downtrend line, lots of investors hyped for all time high. I shared a few posts about possible bullish traps and It happened.
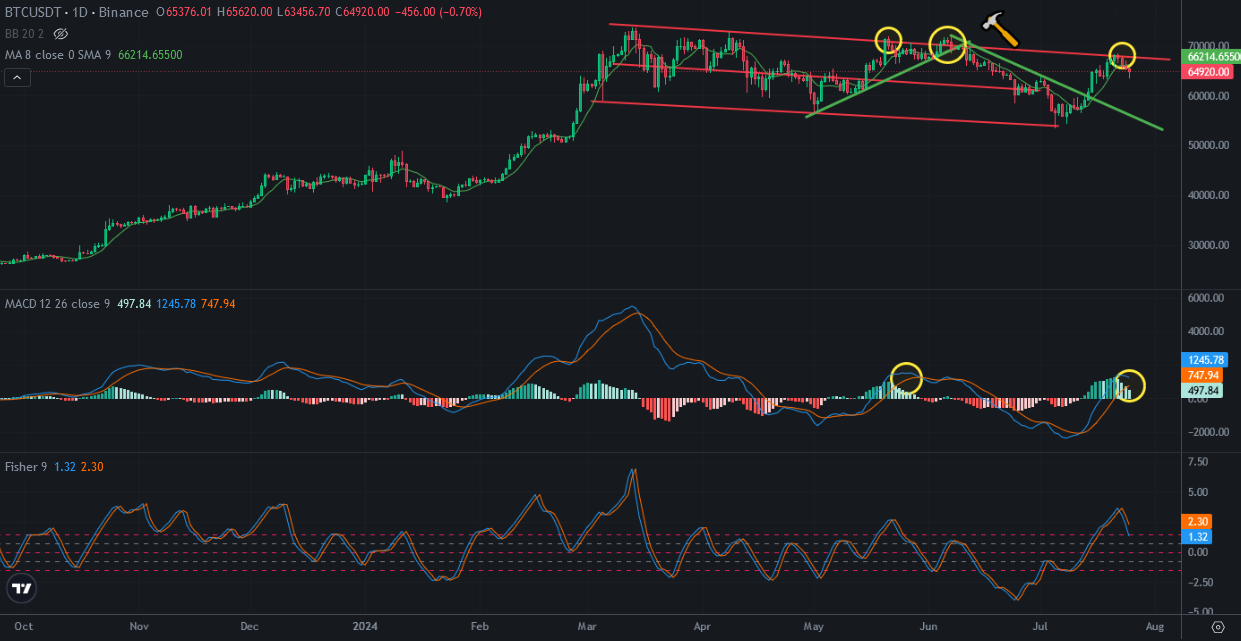
When we look at the indicators of daily chart of Bitcoin, There is similarity between first bullish trap and now. MACD and Fisher Indicators are at the same level. The time is also at the same level after touching to top line of descending channel.
So, it is so possible to price drop on Bitcoin price chart. Altcoin may melt as an ice.
I was waiting with cash to pick up altcoins. I will start to pick up August and during September. It may be great time and level to pick up.
We will see..