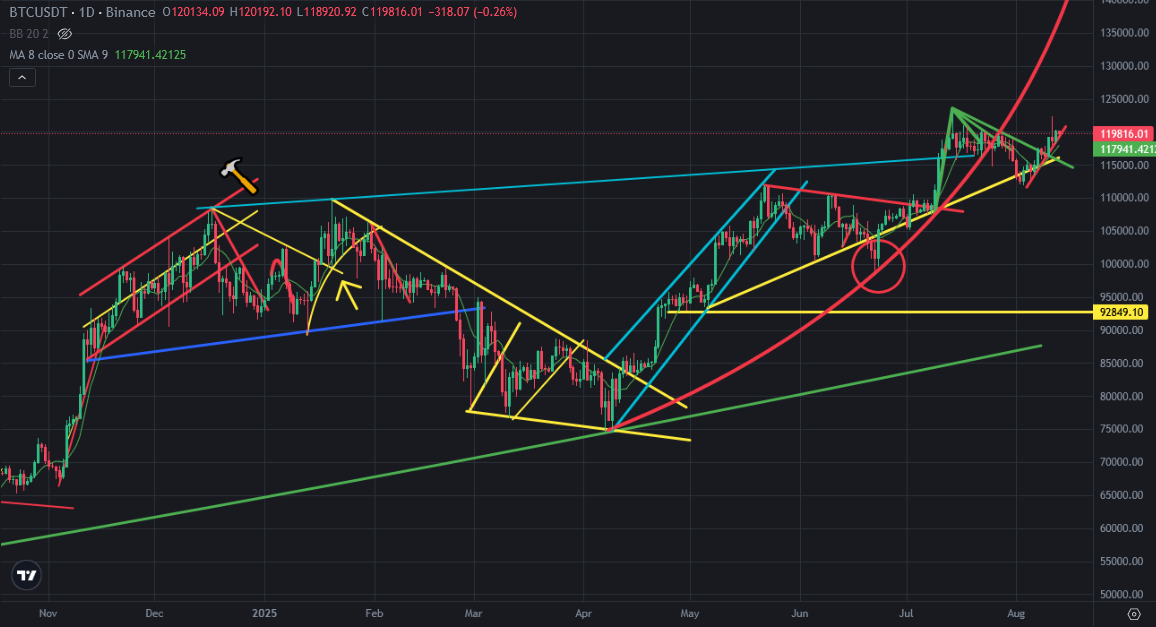
There is mini uptrend line on Bitcoin price chart coming from 112K USD. After touching all time high level, Bitcoin price got price correction and went down to 112K. After reversing up from 112K USD, Bitcoin price is going up slowly without any correction.
There appears mini uptrend line on Bitcoin price chart while going up slowly from 112K USD.
Here you can see daily chart of Bitcoin price. After breaking up mini downtrend line coming from all time high, Bitcoin price got huge daily candles. Even it got huge daily candles, It got red daily candle after huge daily candle. This is why Bitcoin price is going up slowly and mini uptrend line following it.
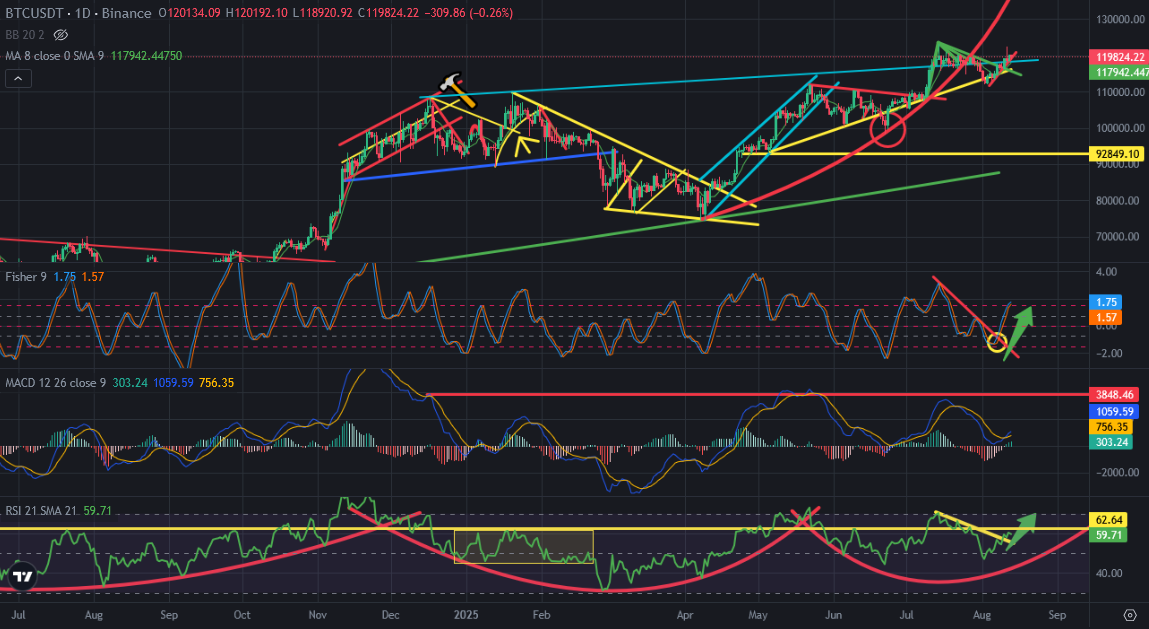
When we look at the indicators on daily chart of Bitcoin, they seem very bullish. RSI Indicator broke up mini downtrend line. Fisher Indicator broke up mini downtrend line. MACD Indicator reversed up from the bottom. It is so possible to see bullish move on Bitcoin price chart for daily chart.
We should follow all time high level. There is only one resistance on Bitcoin price chart that is on all time high level. Bitcoin price broke up all great resistances.
It may be possible to mega bullish season at the end of this year. We should be ready for this bullrun.
After breaking up all time high level on Bitcoin price chart, I will focus about that.
We will see..