Dogecoin surges: Dogecoin (DOGE) has seen a significant price increase, reaching its highest level since 2021. This rise is attributed to growing interest in DOGE futures contracts.
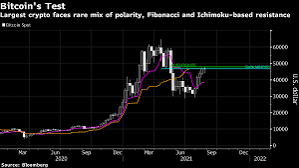
Bitcoin remains steady: Despite recent fluctuations, Bitcoin (BTC) continues to hold around $70,000. Crypto traders seem unfazed by the waning exchange-traded fund (ETF) inflows.
Regulation in India: The Indian government has announced that cryptocurrency transactions will be brought under the purview of money laundering regulations.
.jpeg)
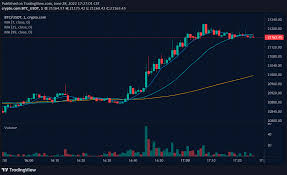
Price charts: These are line graphs that track the price of a cryptocurrency over time. They can be used to identify trends, such as periods of growth or decline.
Market capitalization charts: These charts show the total value of all outstanding coins of a particular cryptocurrency. They can be used to compare the relative size and dominance of different cryptocurrencies.
Volume charts: These charts illustrate the trading activity of a cryptocurrency by showing the total amount of cryptocurrency that has been bought and sold over a specific period.
Scatter plots: These graphs can be used to visualize the relationship between two different cryptocurrencies or between a cryptocurrency and another asset class, such as stocks or gold.