In my last post, I talked about the fractal indicator and one commonly used fractal indicator by traders who h helps them make good trading decisions as the case may be. What do you know about this fractal indicator? Is there more to it?
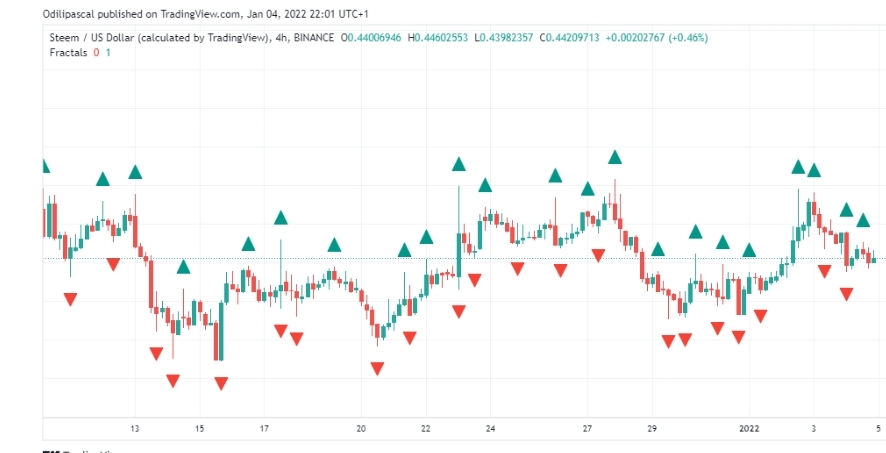
We should not that this factor indicator is used in the market commonly due to its simplicity in identifying chart patterns on signals pertaining to the buy and sell. If we look at the above, we will see the application of this fractal indicator and the arrows it shows….
The arrows are pointing at fractals identified on the charts which could be either the green and red arrow pointing upwards and downwards. The green arrows pointing upward are considered as bearish fractal which gives a signal that it is the best time to sell an asset while the arrow showing red, points downward and I considered as bullish fractals which points to buying of an asset in the market.
These signal information on this indicator are used by most traders in making good trading decision on which they will be in profit if the keep to these signals. This Williams fractal indicator is so effective and can be increased when the indicator is combined with another good indicator like the Agillator. Let us look at the support and resistance of fractal.
The fractal support and resistance indicator helps in sporting support and Resistance by connecting higher lows of past price data with horizontal higher highs. Traders can use this fractal support and resistance for reversal signals in price or price breakouts in the market.
The support and resistance areas are areas of buying and selling pressures that Traders look for a reversal or continuation in price. Discharge below speaks a lot about this fractal support and resistance indicator.
It helps us spot breakouts of prices in the market and it comes with a lower and upper band using the default color that can actually be changed to suit a particular Traders taste or style. The upper and lower bands on the indicator signifies fractal points which are automatically joined together using a trendline to serve as areas of support and resistance.
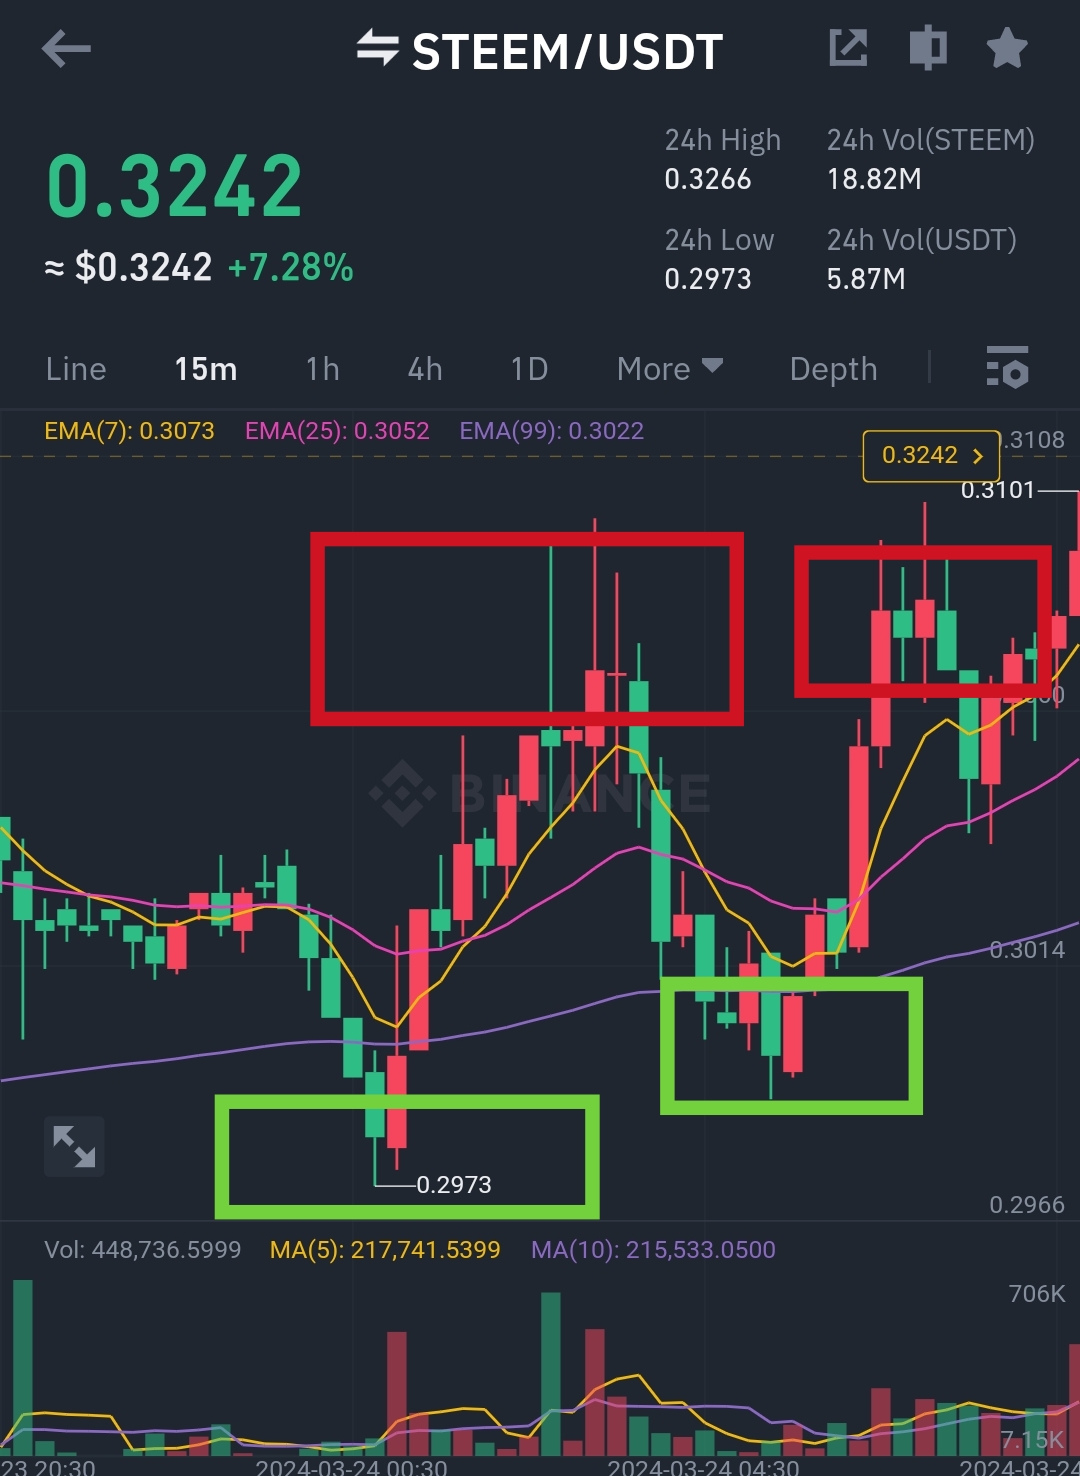
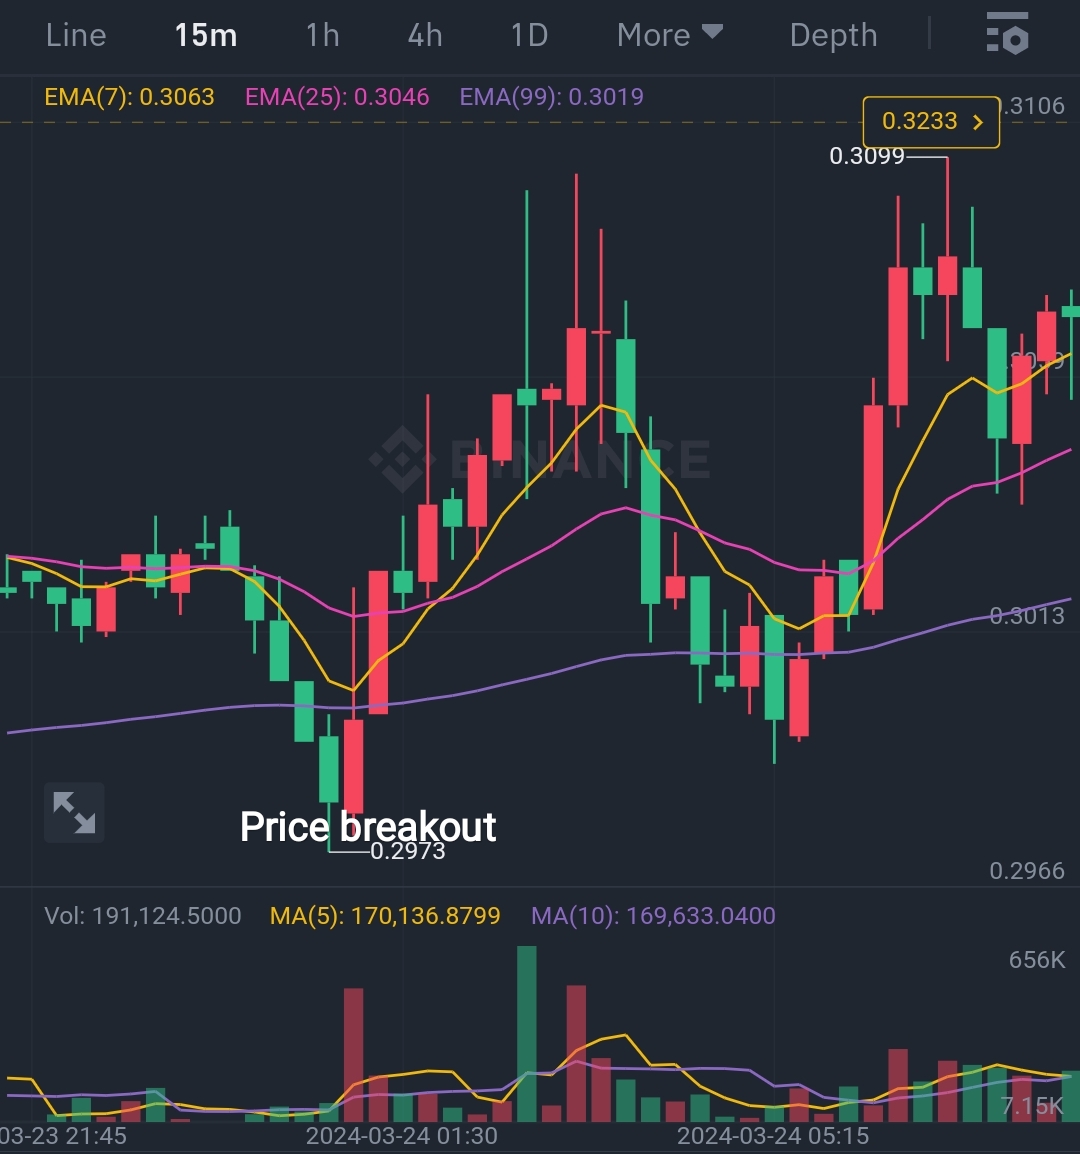
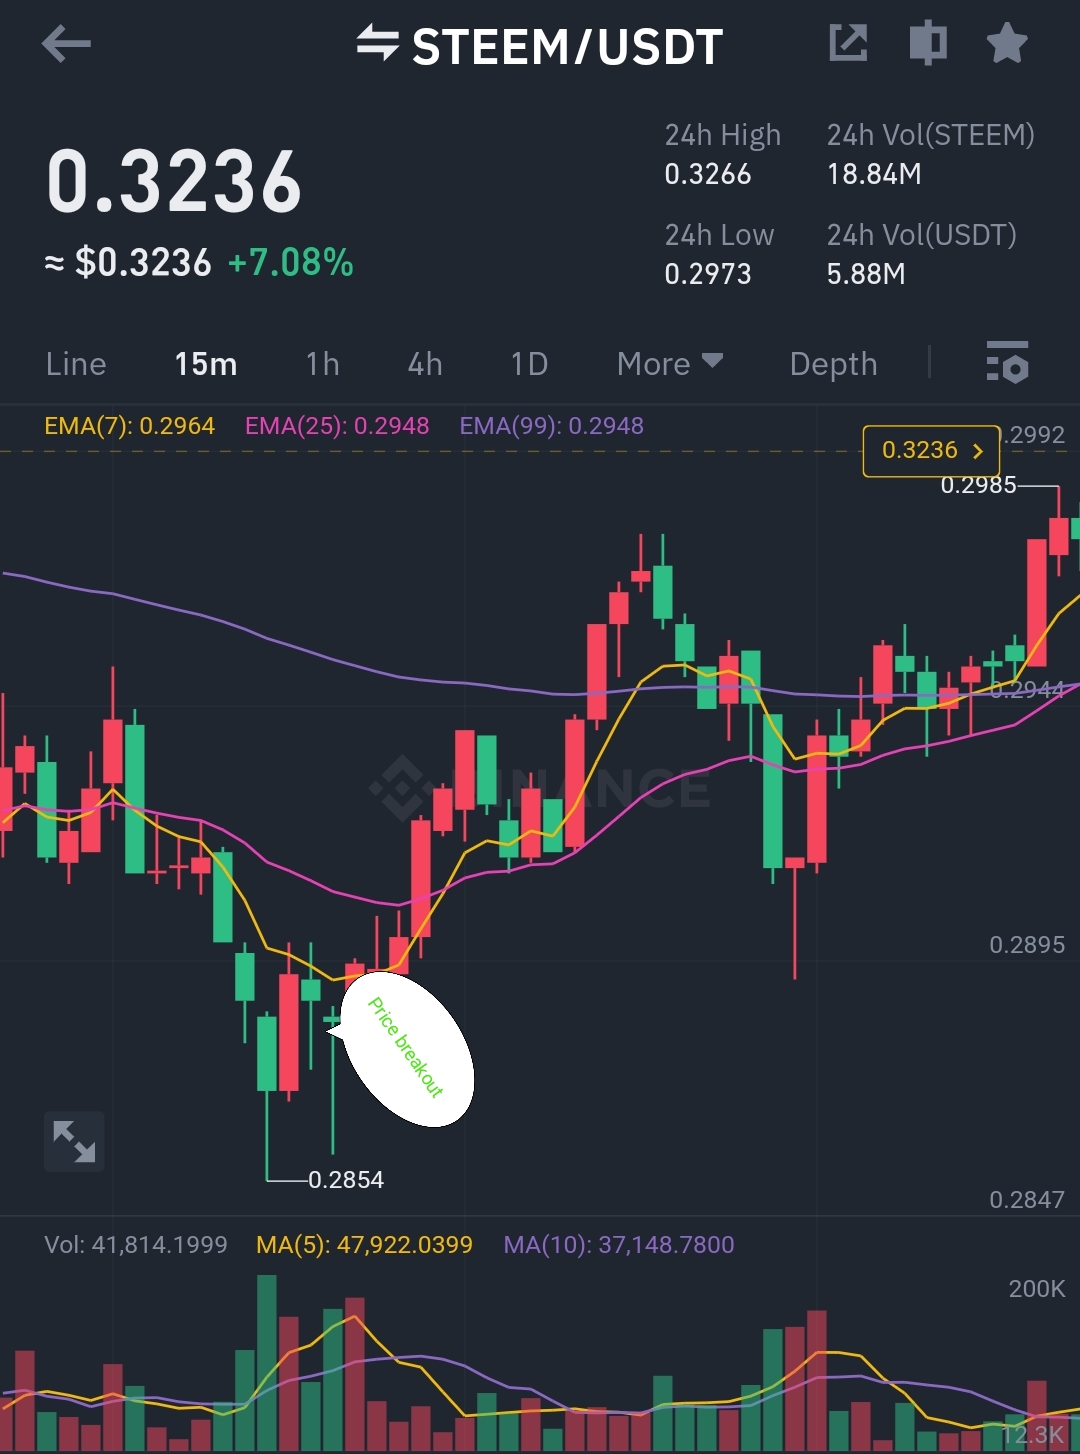
This fractal breakout strategies signals low and short price positions. The break below the lower band is identified as the bearish breakout which is the short on the indicator. The break above the upper band is characterized or identified as a bullish breakout which is the long signal on the indicator. Let's take an example using the steem/usdt chart shown below.
 |  |
|---|
Fractal are commonly known by its infinite detail, meaning you can always see details even if you look very closely. This actually implies that the movement of prices can actually be broken down into movements that are small but reflect the larger pattern so to speak. This is an essential characteristic when analyzing the fractal indicator. The indicator enables Traders to gain a clear understanding of market trends when the price movement of various scales are analyzed.
Another intrinsic characteristic is that it exhibits the same pattern regardless of the scales which Traders use to observe. In the financial market, the movement of price of an asset often echo pass movement of that asset and this indicator is not straight lines for simple curves but they have complex patterns that are usually in great disorder. This non-linear patterns of fractals are reflected in the unpredictable nature of price movement of an asset.
These fractal indicators are used in assessing market trends, market reversals, support and resistance levels, etc. The advantage of this fractal indicators are;
It is easy and simple to use despite the complex mathematical foundation it has and it also detect trend reversals easily which enables Traders to position themselves ahead of significant movement in the market. Despite these advantages, there are some limitations which includes WhipSaw signals during high market volatility which causes confusion and potentially lead to losses if not manage properly by Traders.
It is also known for its subjectivity in identifying fractal patterns which can lead to different interpretations among traders making it a less reliable indicator. Traders should be aware of this and apply the indicator judiciously.
In conclusion, substance are very important things used in Trading to help traders make inform decision and also help them spot important chart patterns in the market. The presence of some indicators, simple to interpret cannot be fully relied on but can have its effectiveness increased when combining these fractal indicators with other technical analysis tools.
All screenshots are from my binance, trading view and canva
Disclaimer :Any financial and crypto market information provided in this post was written for informational purposes only and does not constitute 100% investment advice. It's just basic knowledge every crypto trader or investor should have
.jpeg)