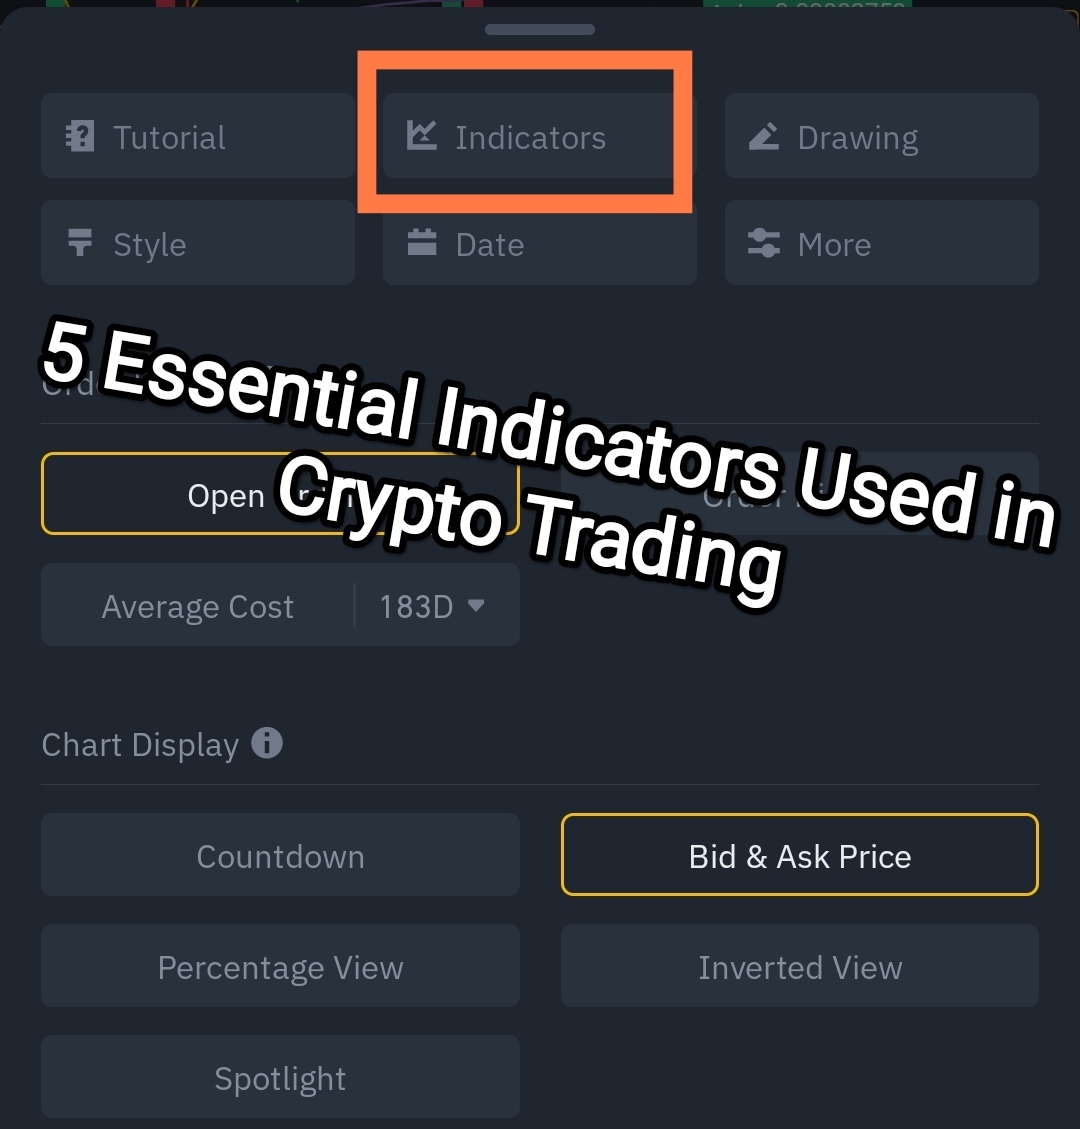
In my last post, I talked about how we can used some indicators in trading effectively on crypto. I did more of the brushing and not practical aspect on how to carry this out. We need to understand the basics first as it will help a lot in the practical aspect of it. I spelt out two indicators remaining 3 of which this post has the three.
Moving average convergence divergence: this is another essential indicator used to determine the momentum or movements in the price of an asset by relating to moving averages together. This indicator consists of two lines which are the signal line and the moving average convergence divergence line calculated by subtracting the 20 EMA from the 12 EMA. To plot this, the 9 EMA i.e the MACD line is considered being the signal line.
Most times, histograms are used by many charting tools show the distance between the MACD line and the signal line. By looking for divergencies between the MACD and the price action, most Traders often gain insight into the strength of the trend that is current.
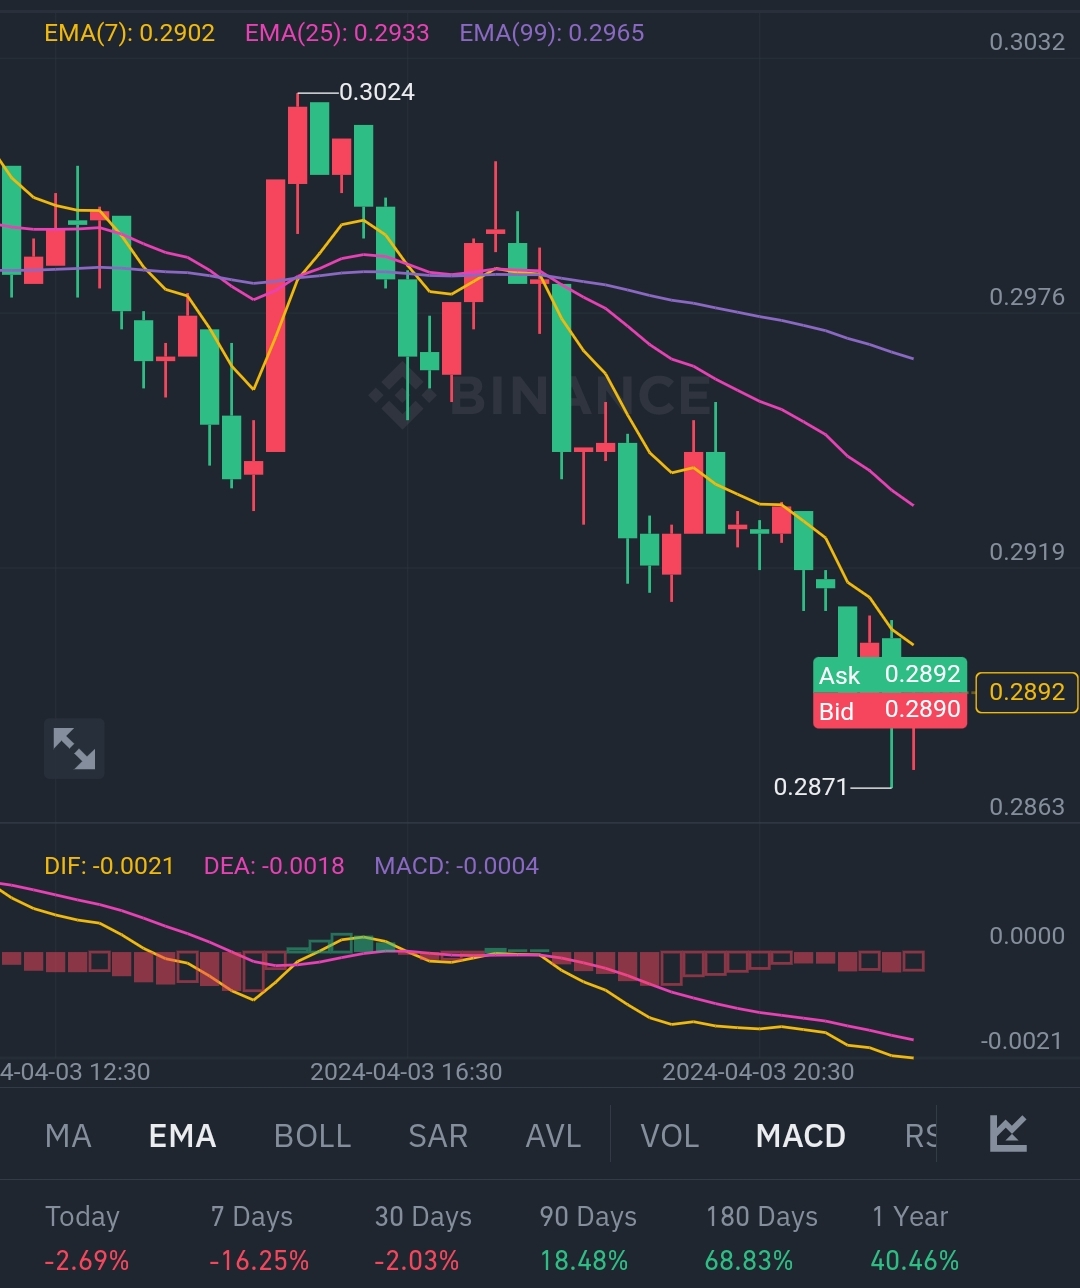
For example, if the price of an asset is making a higher high while there is a lower high in the MACD , the market may be reversing soon. The MACD is telling us that the price is increasing while the momentum is decreasing, so there is higher chances of a reversal occurring in the market. The MACD is actually used in combination with the relative strength index as both indicators are used to measure the momentum of an asset but by different factors.
Traders also use this indicator to look for crossovers between the MACD line add the signal line. If the signal line is below the MACD line, there may be a buy signal in the chart pattern. But if the MACD is below the signal line, there may be a sell signal.
Another important indicator seldomly used is the Stochastic relative strength index indicator which is used to determine the overbought or oversold of an asset. The Stochastic relative strength index values ranges between ( 0 to 1 or 0 and 100).
As the name implies, it is gotten from the relative strength index as derivative and is generated from the relative strength index values instead of price data. It is created by applying the formula called the Stochastic oscillator formula to the ordinary relative index values. This StochRSI reading above 0.8 value is usually considered an overbought while the value below 0.2 may be considered an oversold. The value of 0 means the relative strength index is at its lowest value in a scale of 14.
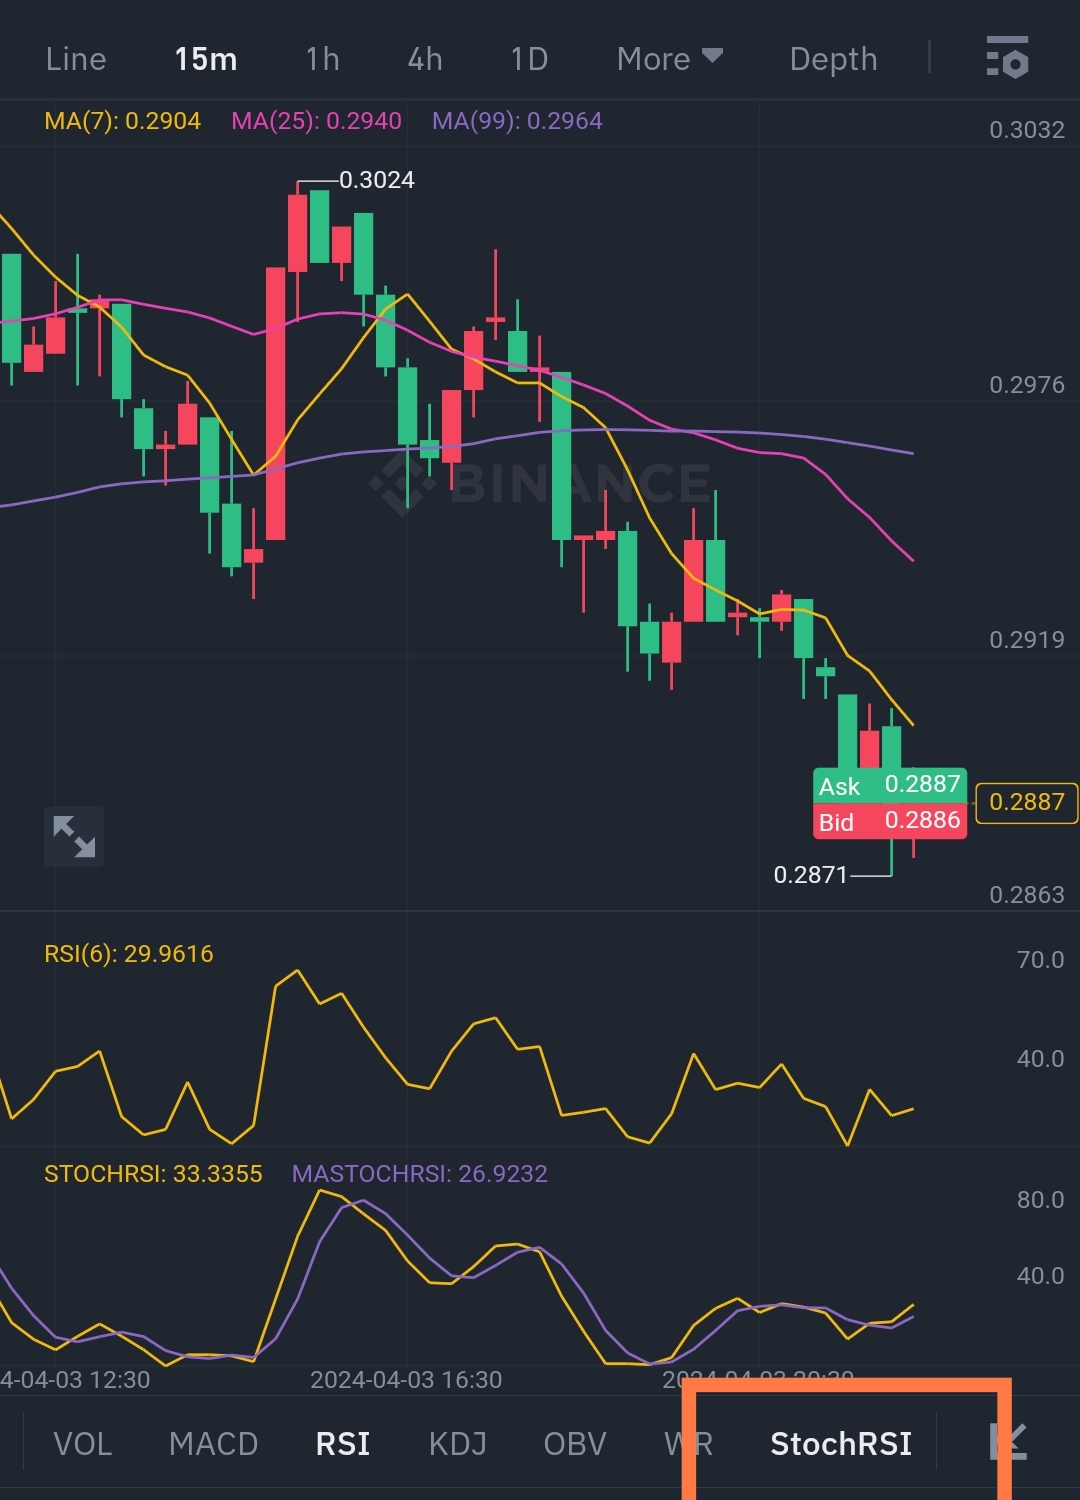
The value of 1 means that the relative strength index is at its highest value. An overbought or oversold STOCHRSI value doesn't mean that the price of an asset will be reversed but it does mean that the RSI values of which the Stochastic Relative Strength index are derived from are near the extremes of their recent readings.
It is also important to keep in mind that this Stochastic Relative strength index is a more sensitive indicator than the relative strength index indicator as it tends to generate misleading signals regularly.
The Bollinger bands is another important indicator that measures the volatility of the market as well as the oversold and overbought conditions in the market. They are made up of three lines which includes the upper band, lower band and the middle band which happens to be an SMA.
The settings vary in these three lines as the lower and upper bands are two standard deviations away from the middle band. As the distance between these two bands increases, the volatility of an asset in the crypto market increases and decreases as well if there are changes. The closer the price is to the upper band, the closer to overbought conditions the charted asset may be.
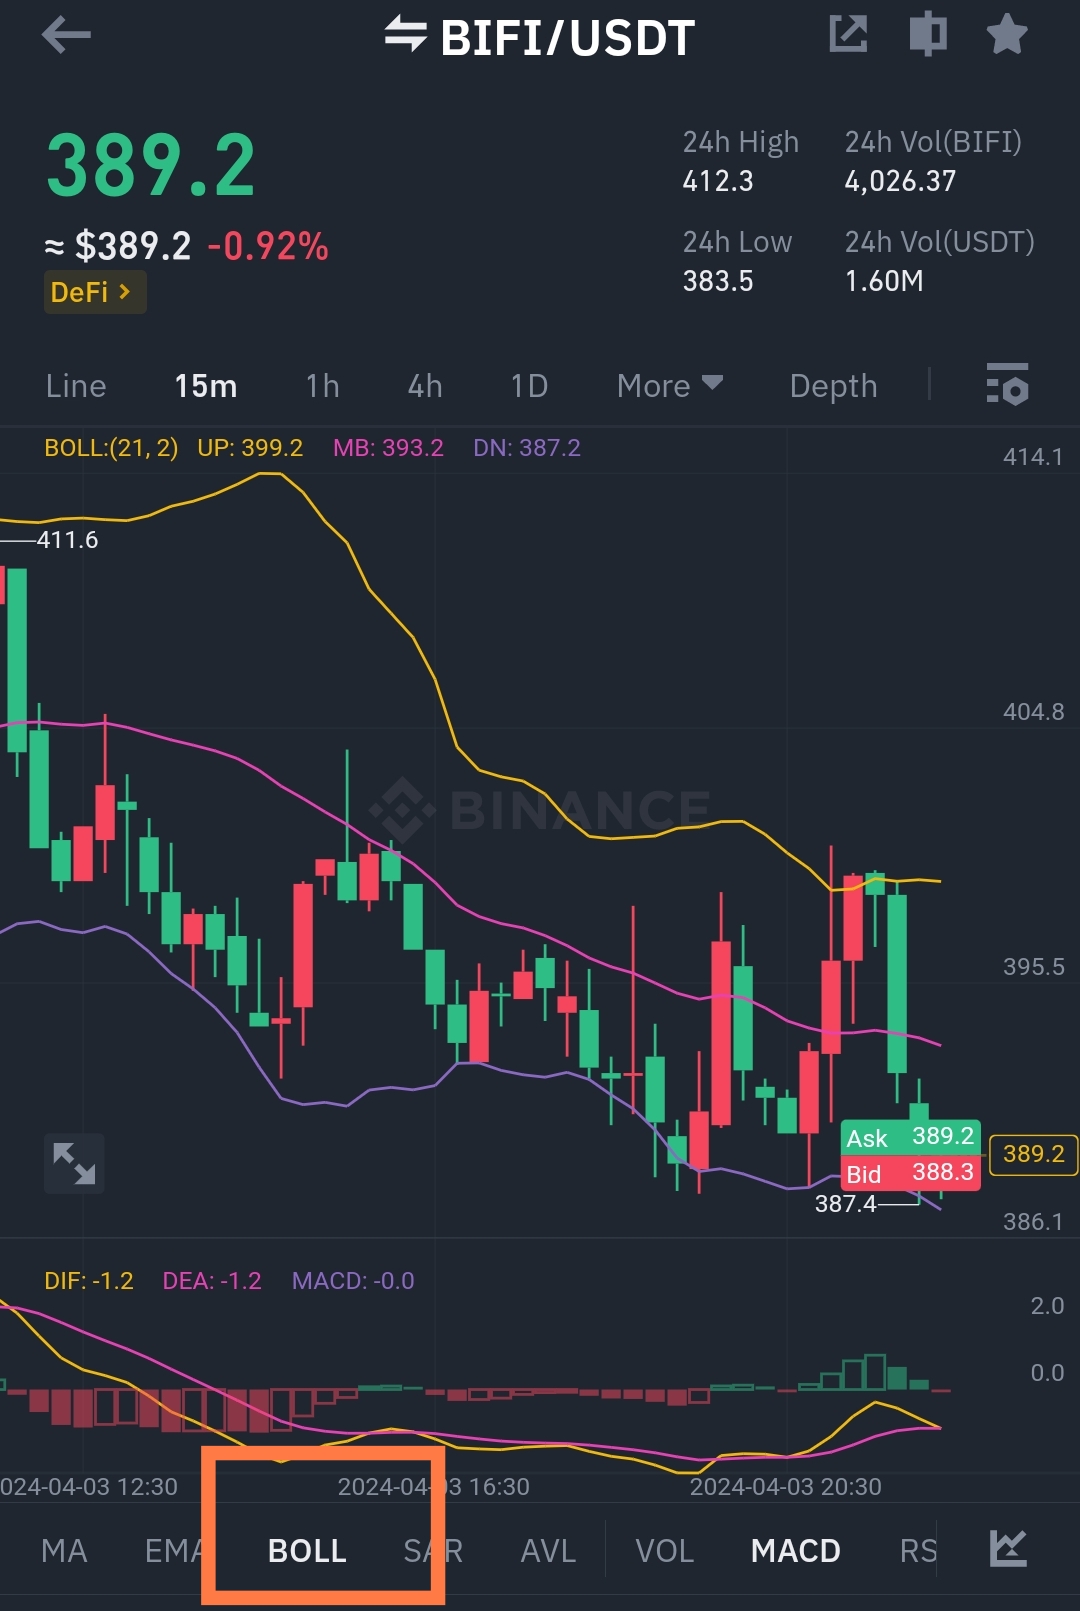
The closer the price is to the lower band, the closer to oversold conditions it may be. The price will stay within the bands sometimes but on rare occasions, it does break above or below these bands. The behavior is an indicator of extreme market conditions.
It is important to consider that the interpretation of the data shown in the indicators can be very sensitive. As such, it is wise to consider if personal biases are affecting your decision.
Disclaimer :Any financial and crypto market information provided in this post was written for informational purposes only and does not constitute 100% investment advice. It's just basic knowledge every crypto trader or investor should have
All screenshot are from my binance