In the crypto ecosystem, there are seven tools needed to trade effectively without incurring losses while carrying out these transactions or activities. Before going to farm, you know you can't just go without carrying your hoe and cutlass which are very important than any other farm tools. With these tools, you can navigate your way through carrying out a successful farming activity and not anyhow tools but sharp ones.
If you take a blunt machete to the farm, you may not use it for anything useful as it would give you tough time. So you need a sharp market to accomplish this. This is same with crypto. Before trading the crypto market, you need indicators which serves as tools that will help traders on the sun the price movement of an asset and as an indicator, it will help new identify chart patterns and trading signals easily.
There are lots of indicators used for this purpose but the most essential ones used in technical analysis that have proven effective are listed in the course of this post. These indicators helps in the reduction of risks of which Traders combine the indicators with fundamental analysis and other trading methods.
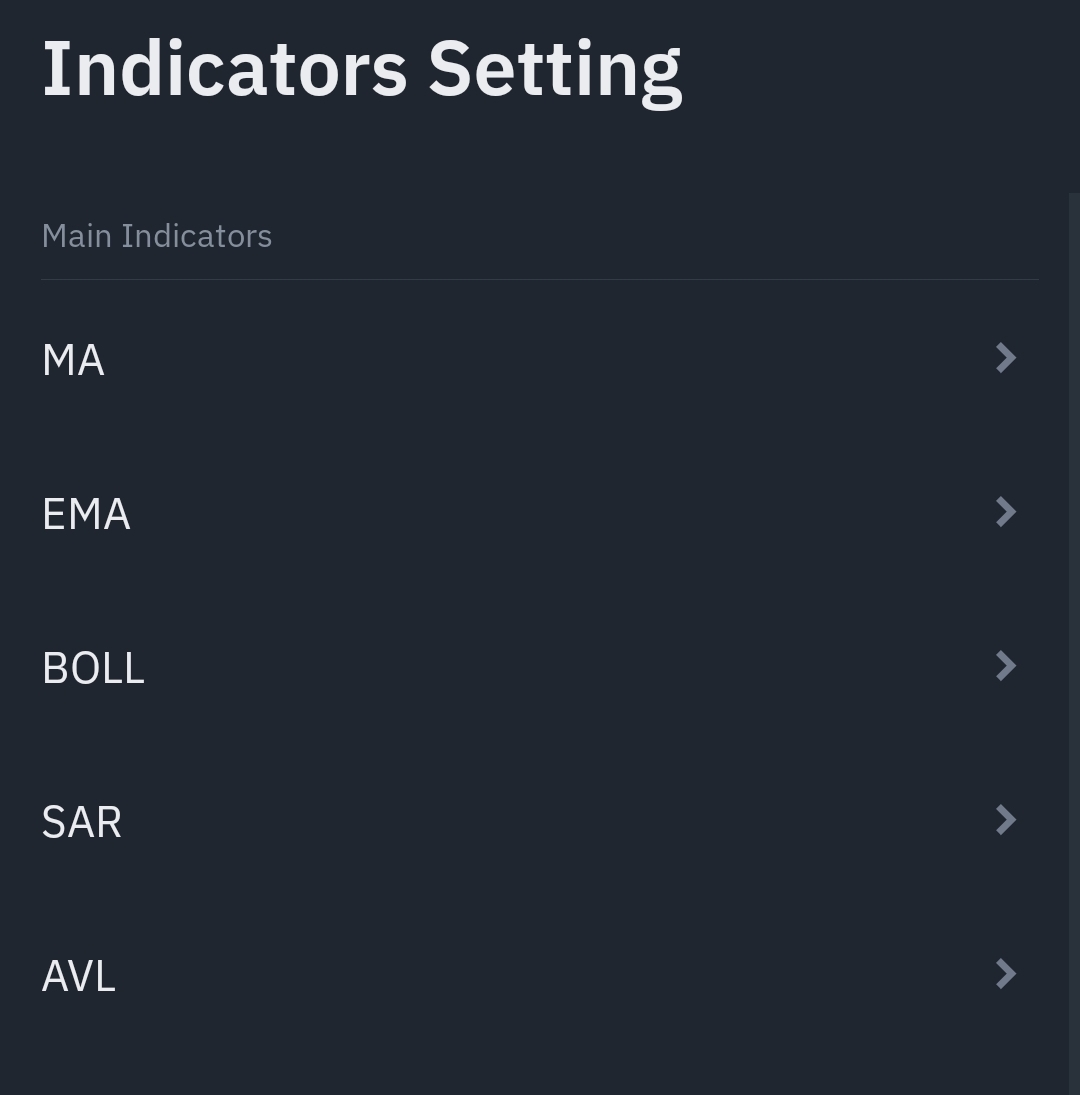
**Every Trader in the market have the choice to make on which two will best fit their unique trading style. These indicators include,** **MA, RSI, MACD, BB and StochRSI**.
 |
---|-----
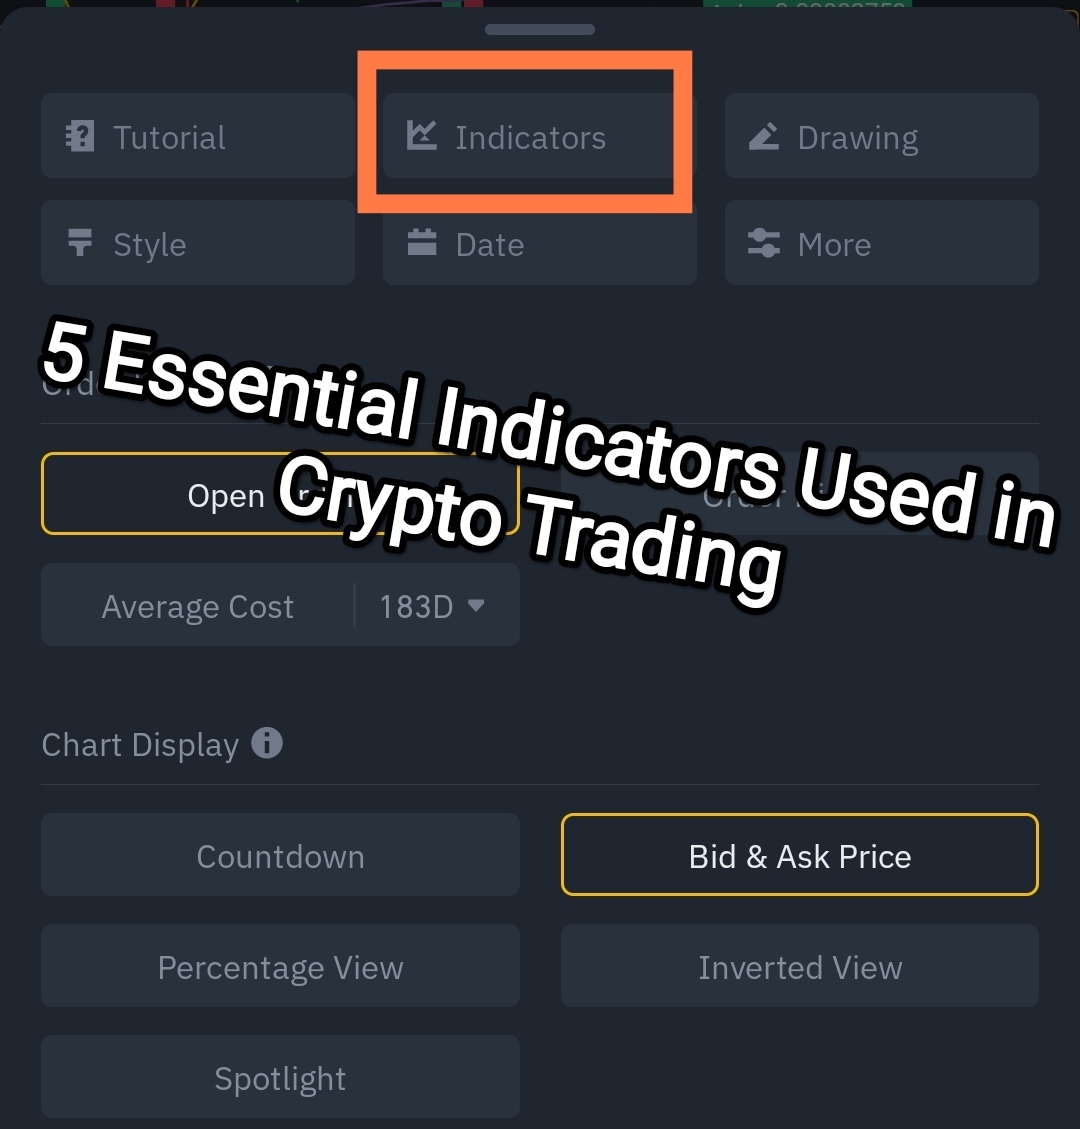
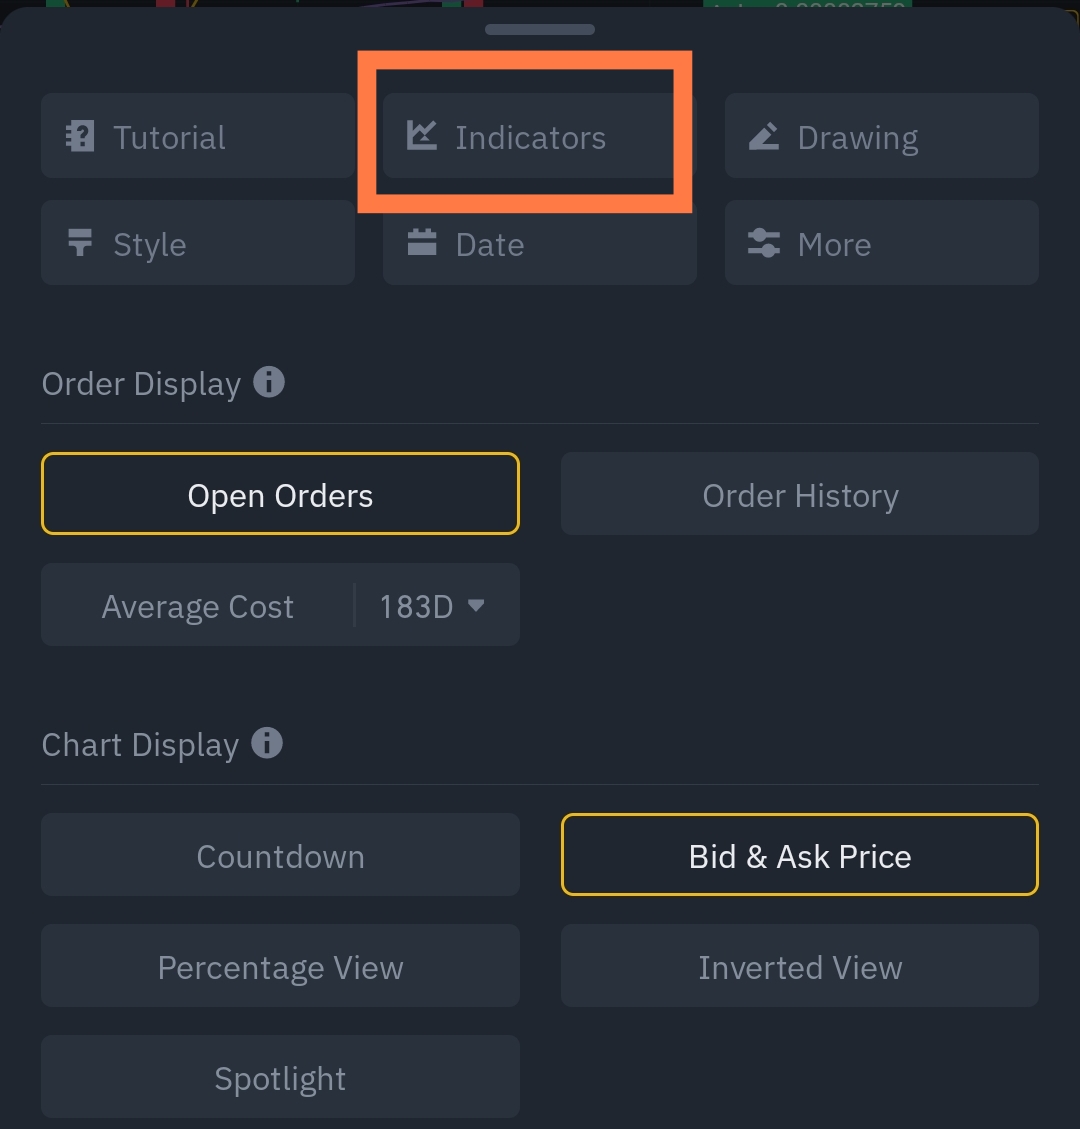
I'll explain it in details for our understanding. This post will highlight how they are used and what they are. **Why technical analysis indicators one may ask?** Traders use technical indicators to gain additional insight in the price movement of an asset which makes it easier to identify chart pattern in the market. These indicators are widely known by **swing Traders, long-term investors and sometimes day traders.** Let's start with the **moving average indicator.**
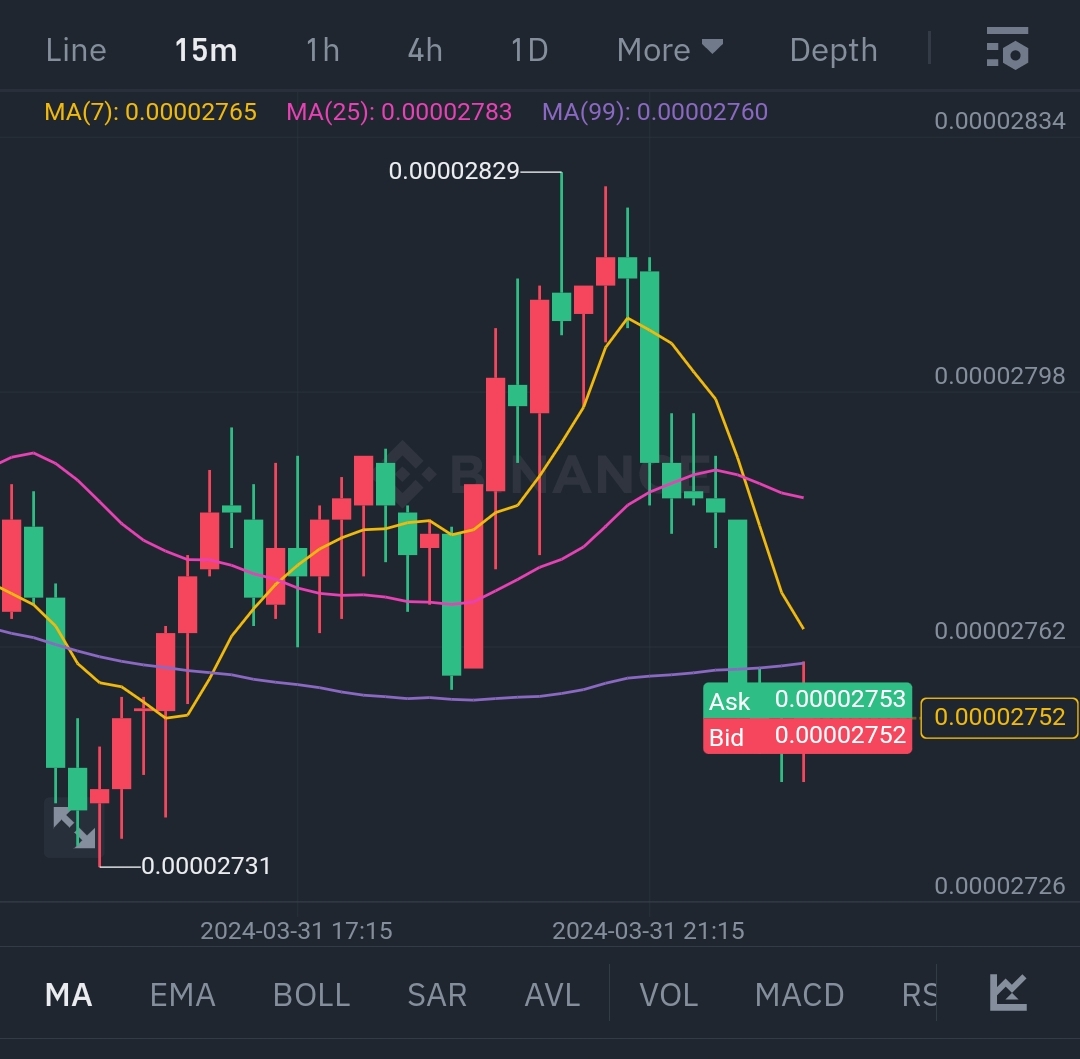
Moving Average
|
|-
This indicator is a commonly used indicator as it helps smooth out price action and highlight the direction of the trend in the market. Since they are based on past price data, this moving averages are known as **lagging indicators.** The two most commonly used moving averages are the SMA and EMA. The EMA which is the exponential moving average is calculated in a way that gives or at weight to the current price data making it reactive to movement in price. **The SMA which is the simple moving average** is used by taking the price data from the specified period and produces an average. The longer the period, the greater the lag.
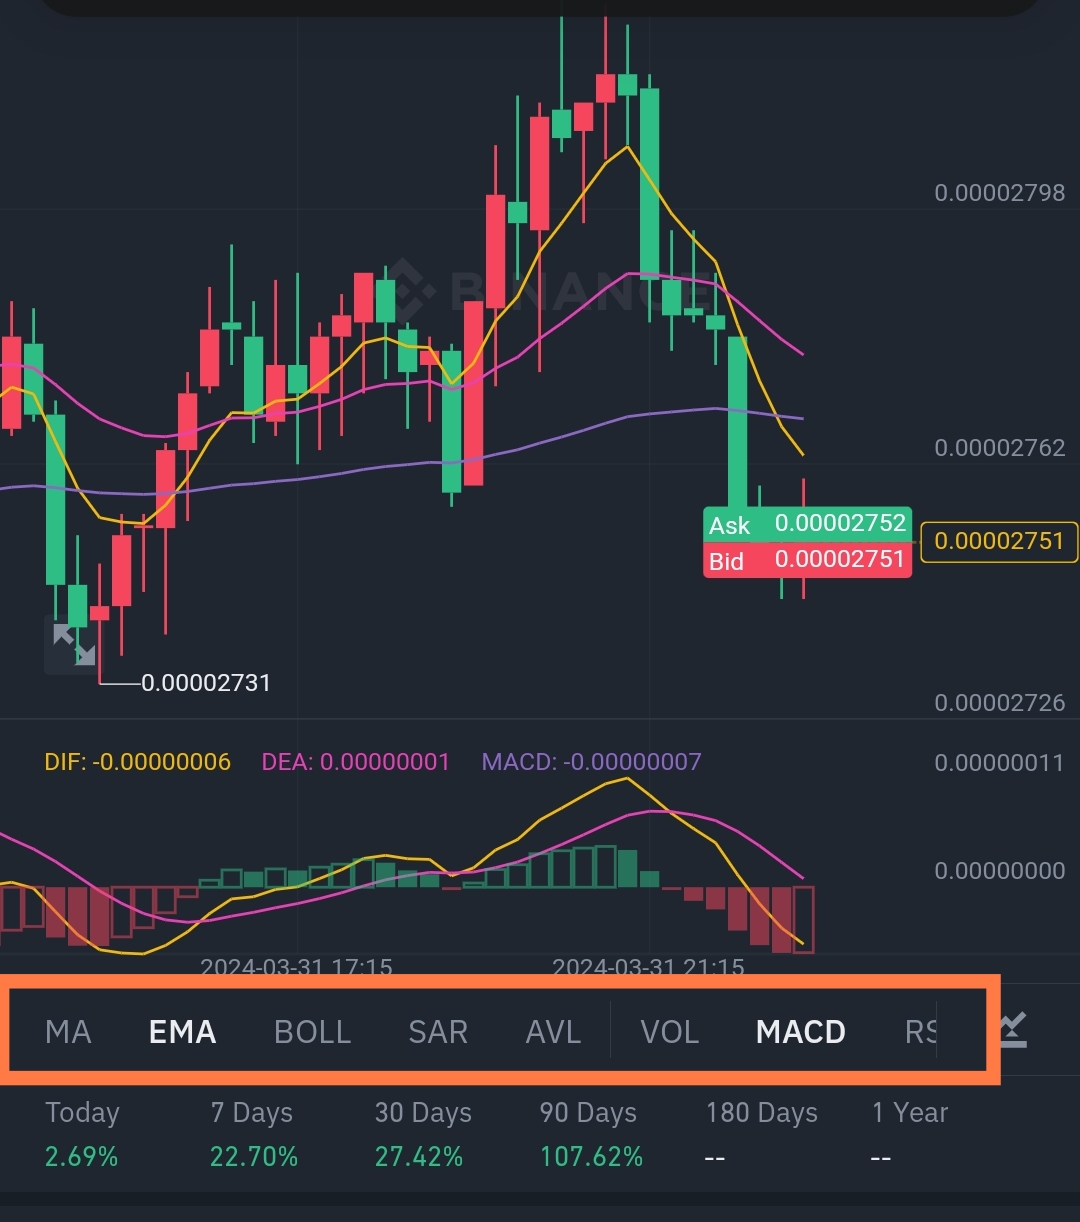
If a 200-day SMA is used, it will react slower to current price action than the 50-day SMA period. Traders who uses the average's crossovers may use it as buy or sell signals. To illustrate, if a 200-day simple moving average crosses below the 500-day SMA, it may be considered as a signal that is selling which means that the average price over the last 200 days is now below that of the last 500 days.
If a 200-day simple moving average crosses above the 500-day SMA, it may be considered as a signal that is selling which means that the average price over the last 200-days is now above that of the last 500-days. Short-term price movements are no longer following the uptrend in selling. So the trend is likely to have a reverse soon.
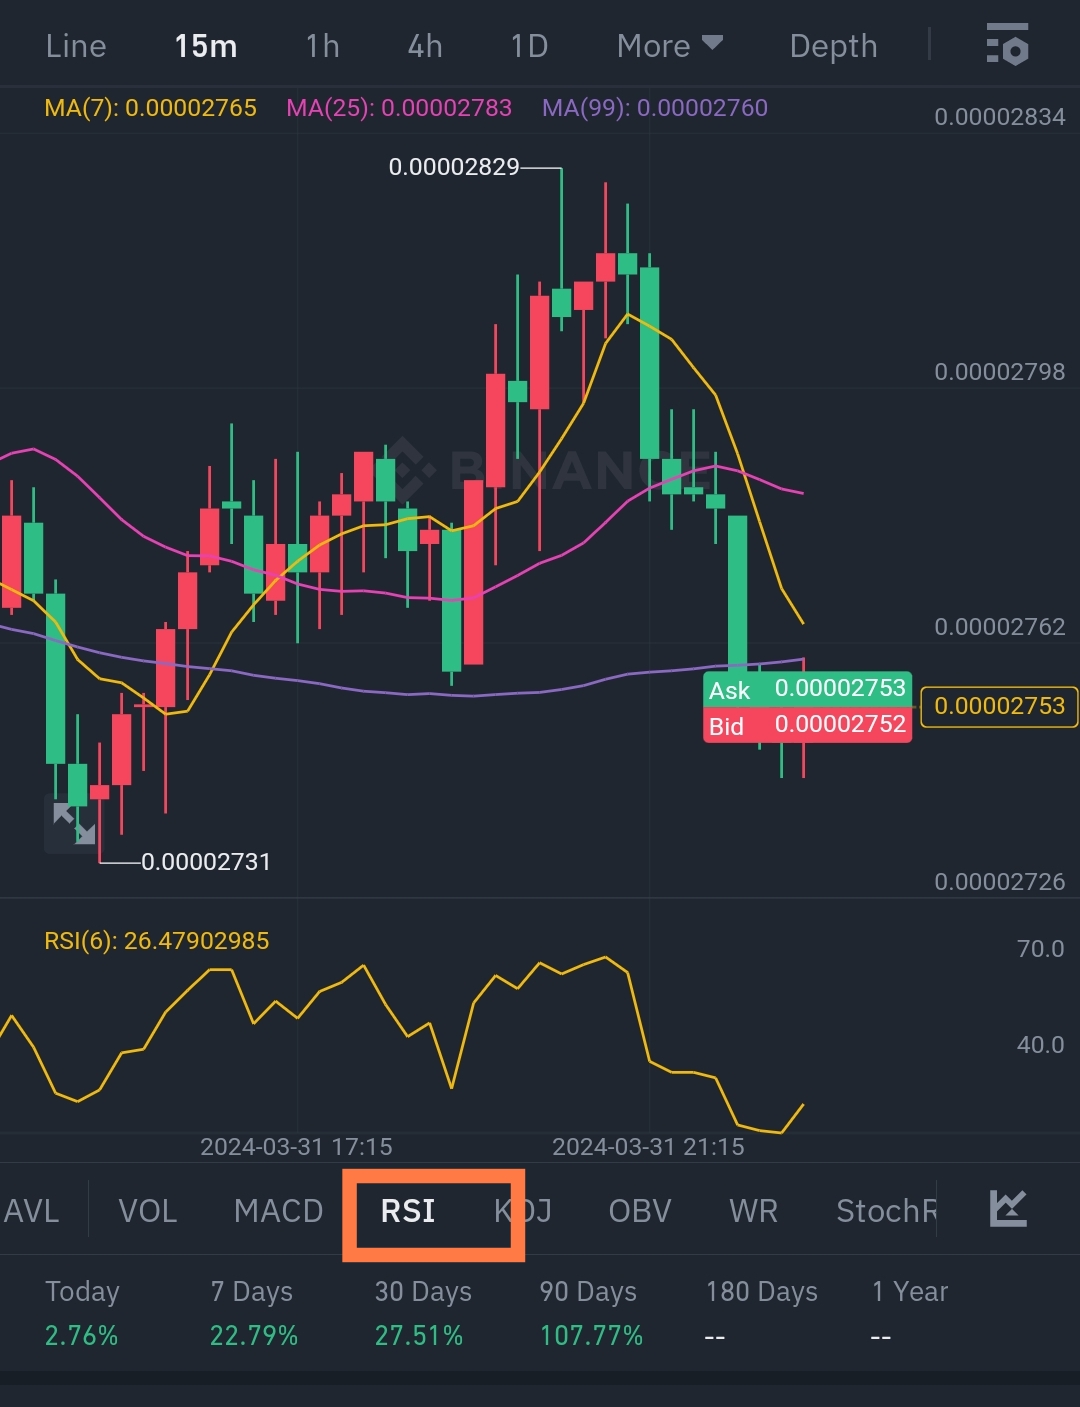
The RSI Indicator
|
|-
The RSI is an indicator that shows if an asset is oversold or overboard which is done by measuring the size of the recent price changes. The standard setting is the 14 days for daily charts and 14 hours for early charts. It is also known as a momentum indicator that shows the rate at which the price of an asset is moving meaning that if the momentum is increasing while the price is rising, the uptrend is actually strong as more investors are setting in and if the momentum is decreasing while the price is rising its may be on the sellers control as the market will be reducing.
There's still yet another indicator that works well and in my subsequent post, how these ones and the ones yet to be discussed will be used
> **Disclaimer** :Any financial and crypto market information provided in this post was written for informational purposes only and does not constitute 100% investment advice. It's just basic knowledge every crypto trader or investor should have
**All screenshots from my binance**