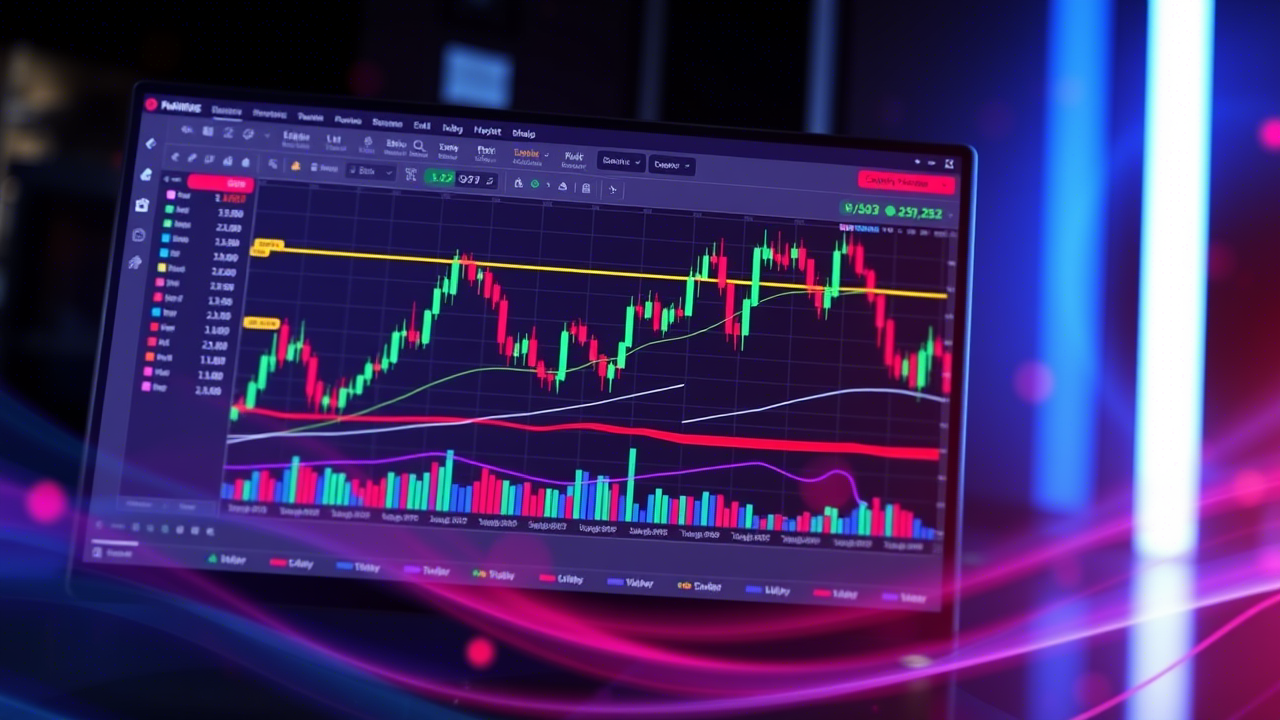
How to Read Crypto Charts: A Beginner’s Comprehensive Guide
Understanding how to read crypto charts is a fundamental skill for anyone stepping into the world of cryptocurrency trading or investing. With thousands of digital assets available and markets that can change in an instant, interpreting chart data effectively can be the difference between success and missed opportunities. This guide will break down everything you need to know about reading crypto charts, from basic concepts to advanced analysis techniques.
Crypto charts are visual representations of price movements over time, forming the backbone of technical analysis. They allow traders to identify trends, patterns, and potential price movements. The most common types of charts include:
Reading crypto charts equips you with actionable insights into market behavior, enabling smarter trading decisions. Key benefits include:
To master chart reading, you need to understand the following elements:
The time frame you choose affects how you interpret data. Common options include:
- Minute Charts: Ideal for day traders focusing on short-term fluctuations.
- Hourly/Daily Charts: Suitable for swing traders holding positions for days or weeks.
- Weekly/Monthly Charts: Best for long-term investors analyzing broader trends.
Tip: Use multiple time frames to get a holistic view of market conditions.
Price action refers to how a cryptocurrency’s price behaves over time. Key patterns include:
- Higher Highs and Higher Lows: Signals a bullish trend.
- Lower Highs and Lower Lows: Indicates a bearish trend.
These levels help you decide when to enter or exit trades.
Indicators provide additional context for analyzing charts. Popular ones include:
- Moving Averages (MA): Smooth out price data to highlight trends.
- Relative Strength Index (RSI): Identifies overbought or oversold conditions.
- MACD (Moving Average Convergence Divergence): Highlights momentum and potential reversals.
Follow these steps to interpret crypto charts like a pro:
Select a platform that offers real-time data and advanced tools. Some popular options include:
- TradingView
- CoinMarketCap
- CoinGecko
Look for patterns that indicate the current market direction. Pay attention to support and resistance levels to make informed predictions.
Use indicators to validate your observations from price action. For example, RSI can confirm whether an asset is overbought or oversold.
Volume reflects the strength of a price movement. High volume during an uptrend suggests strong buying interest, while low volume may signal weakness or a reversal.
Cryptocurrency markets are highly sensitive to news and events. Follow trusted sources and social media platforms to stay informed about developments that could impact prices.
Learning how to read crypto charts is a critical skill for navigating the volatile world of cryptocurrency trading. By mastering the components outlined in this guide—time frames, price action, support/resistance levels, and technical indicators—you’ll be better equipped to analyze market trends and make informed decisions.
Ready to take your crypto trading to the next level? Start practicing how to read crypto charts today and unlock the tools you need for trading success!