|
 TradingView
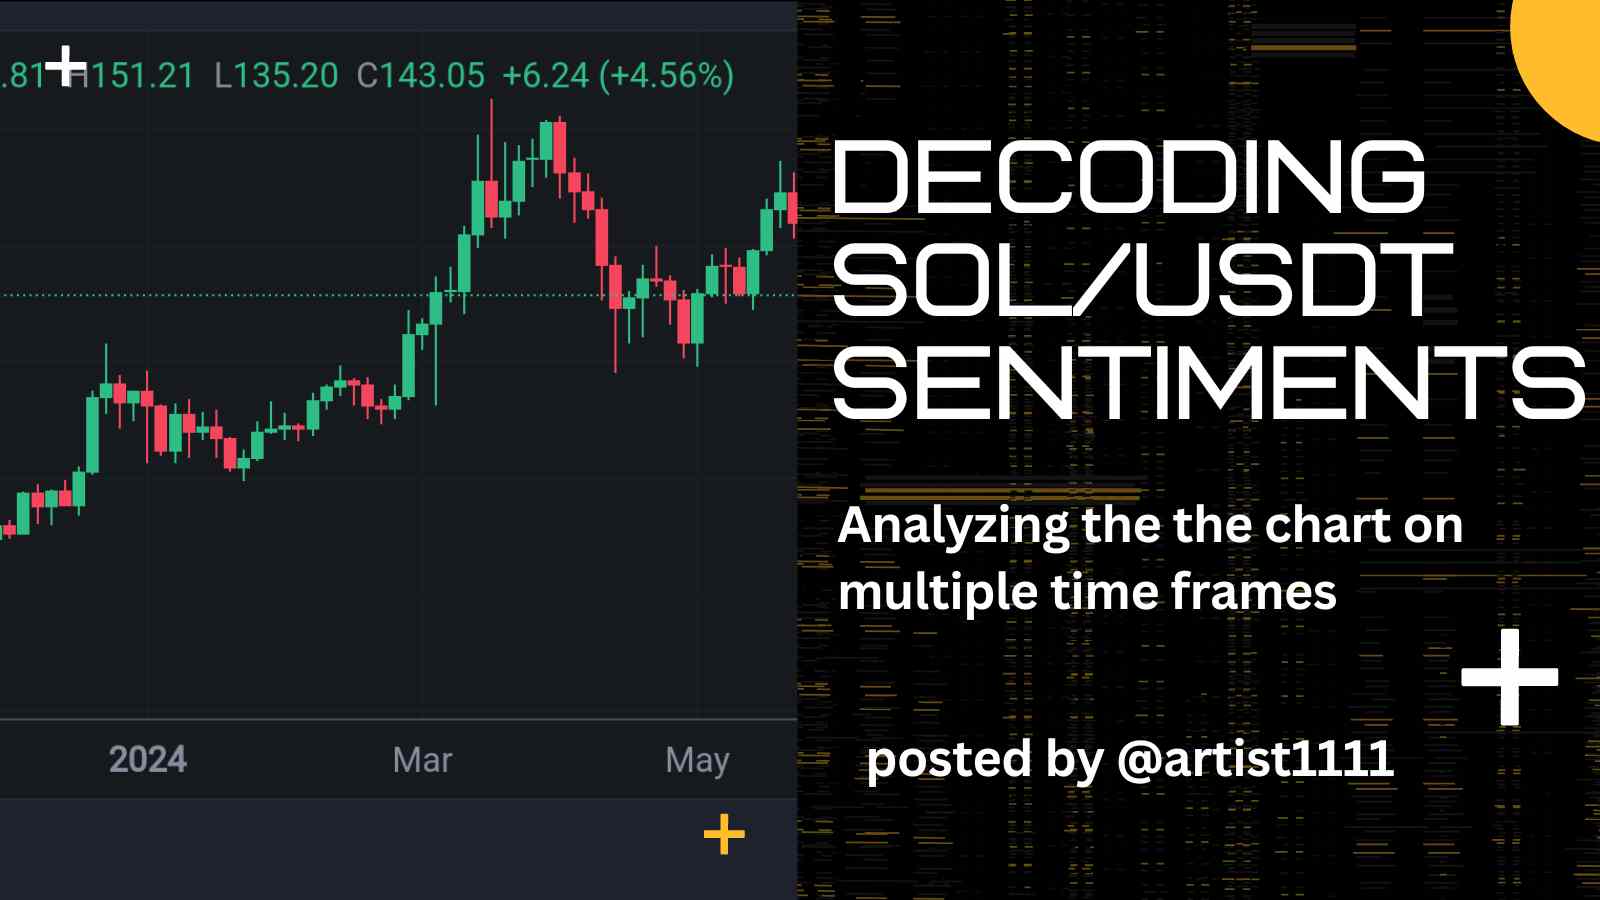
 Greetings to everyone in Steem Alliance and others visitors. This is me @artist1111 once again . Today, I am once again going to discuss the market sentiments by understanding the price action of SOL across different time frames and closely take a look by volume which makes idea clear.
I am pretty sure that this analysis will provide pretty good highlight the current SOL/USDT market sentiment on 28/06/2024 and potential future movements.
Let's don't wait, jump in by first looking at the daily time frame, then take a look of volume , and finally the 4-hour chart.
|
 TradingView
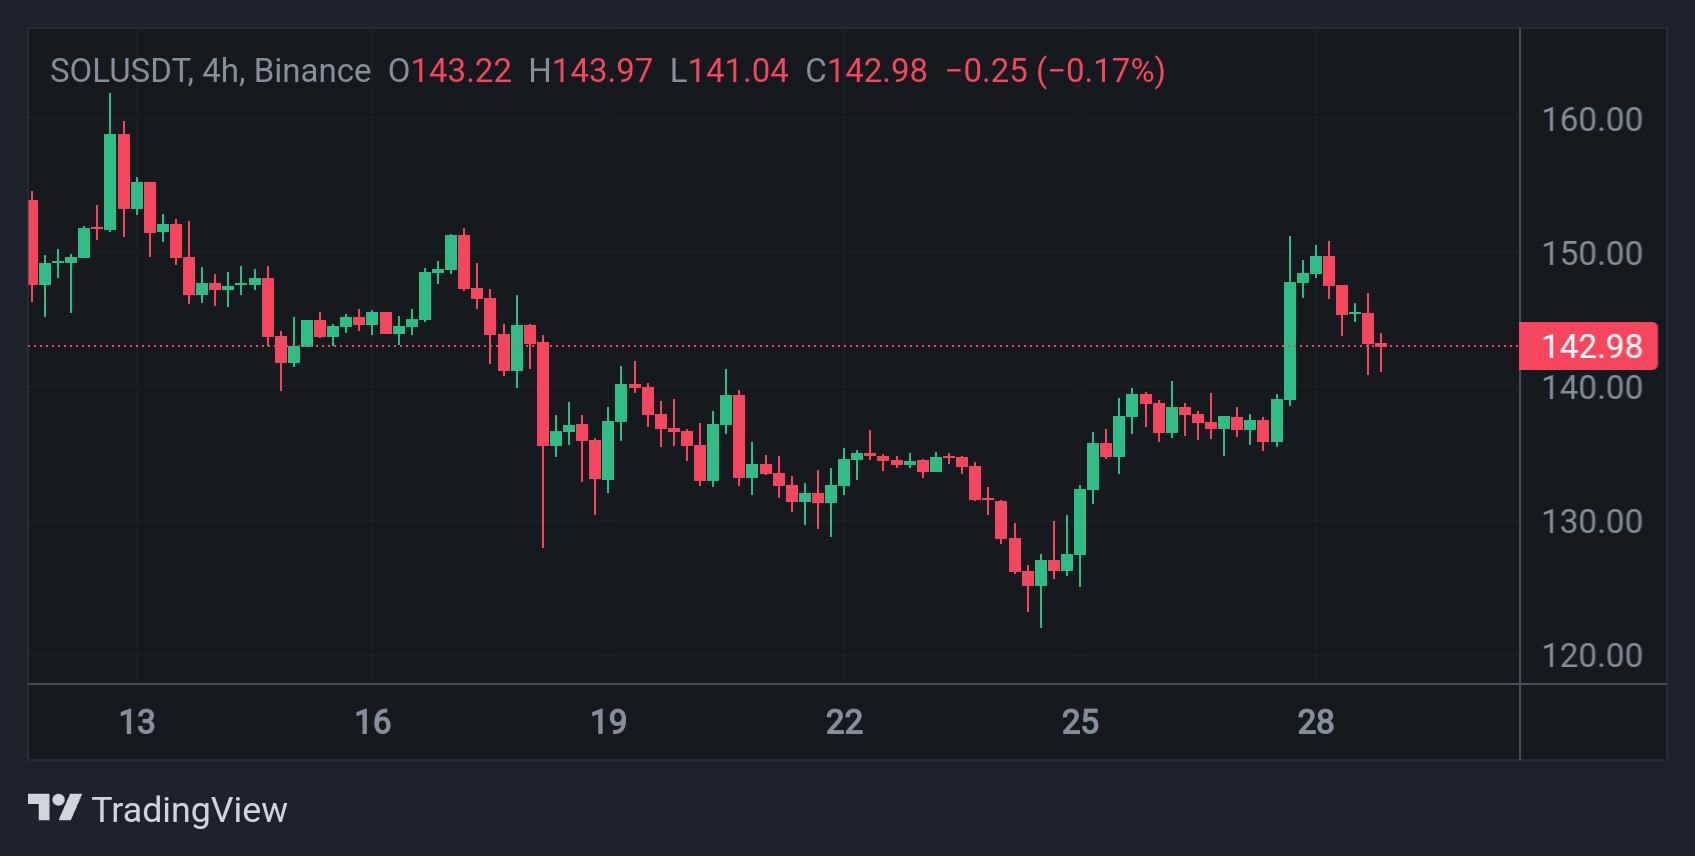
First, I open the time frame of 4 hours of SOLUSDT. Price currently trades at 142.98. The price recently hit highs of approximately 149.71 before it retreated.
It created lower highs and lower lows that show a short-term bear trend. However, there has been some interest in buying as the price recovered from about 130 to where it is at the moment.
There's resistance around 150 and support near 140. It may be due for a fall back to the $140 support area if it cannot break above $150.
|
 TradingView
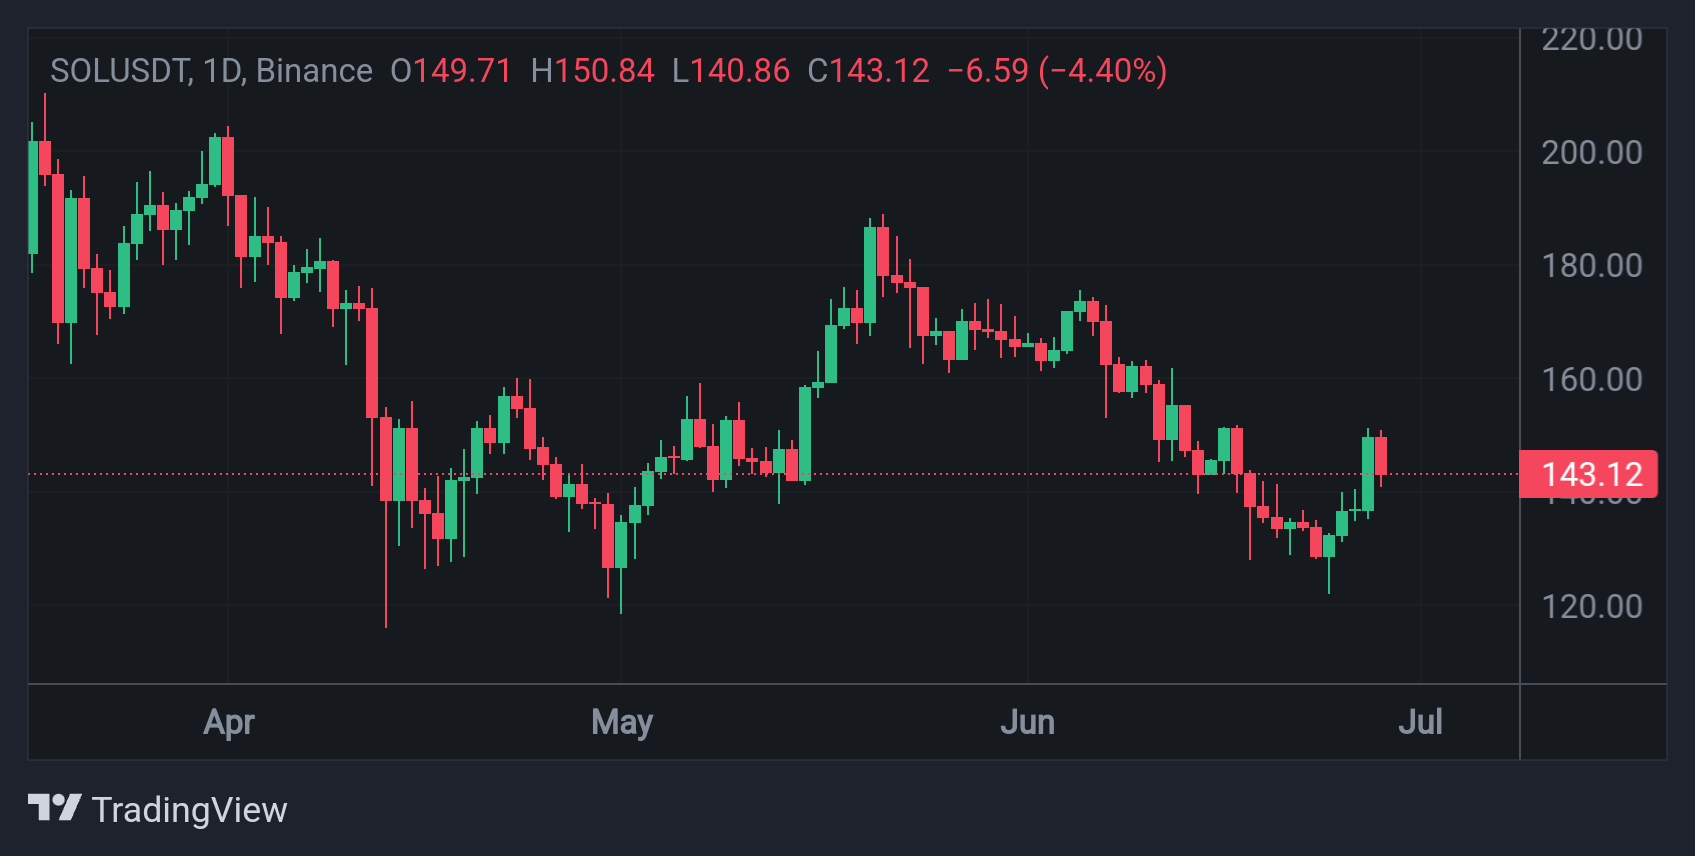
 Moving on, I am looking at the daily time frame. Here, the price is $143.12. In the past months, SOLUSDT has shown very clearly a downward trend, where highs in the vicinity of $220 have been made during the past months, while recent lows are closer to $120. Now, the price action forms a little recovery off the recent low, marked with some green candles that catch the eye, from time to time, to the top, indicating some bullish sentiment.
Nevertheless, the price is still below the important resistance of $150, similar to the 4-hour analysis. If the bulls could push the price above $150, it would probably advance towards $160 and above.
To the downside, if the price breaks below $140, it might find itself revisiting the support levels around $130 and $120.
|
 TradingView
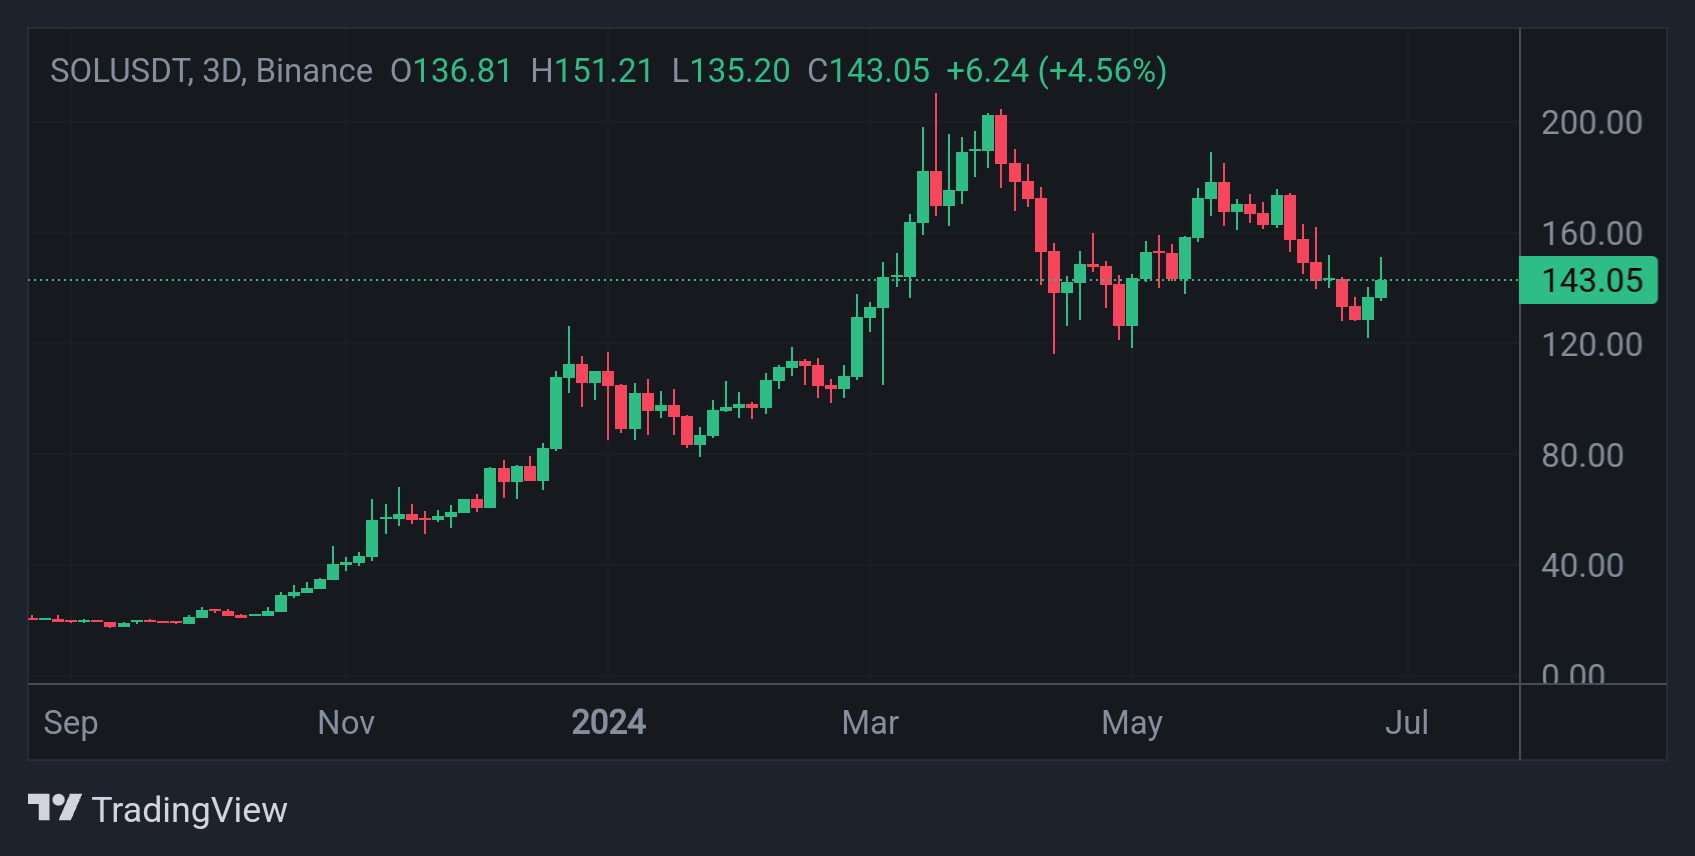
Then, I switch to the 3-day time frame where the price stands at $143.05. This wider perspective shows the big uptrend from September 2023 to early 2024, after which it goes into a phase of consolidation. The price had run up to $220 and then formed lower highs and lower lows—a correction within the context of the longer-term uptrend.
Current candles give an indication that there might be either a reverse or at least some consolidation around the $140 level.
This means a break above $150 could shift the action to an uptrend, targeting $180 and possibly $200.
|
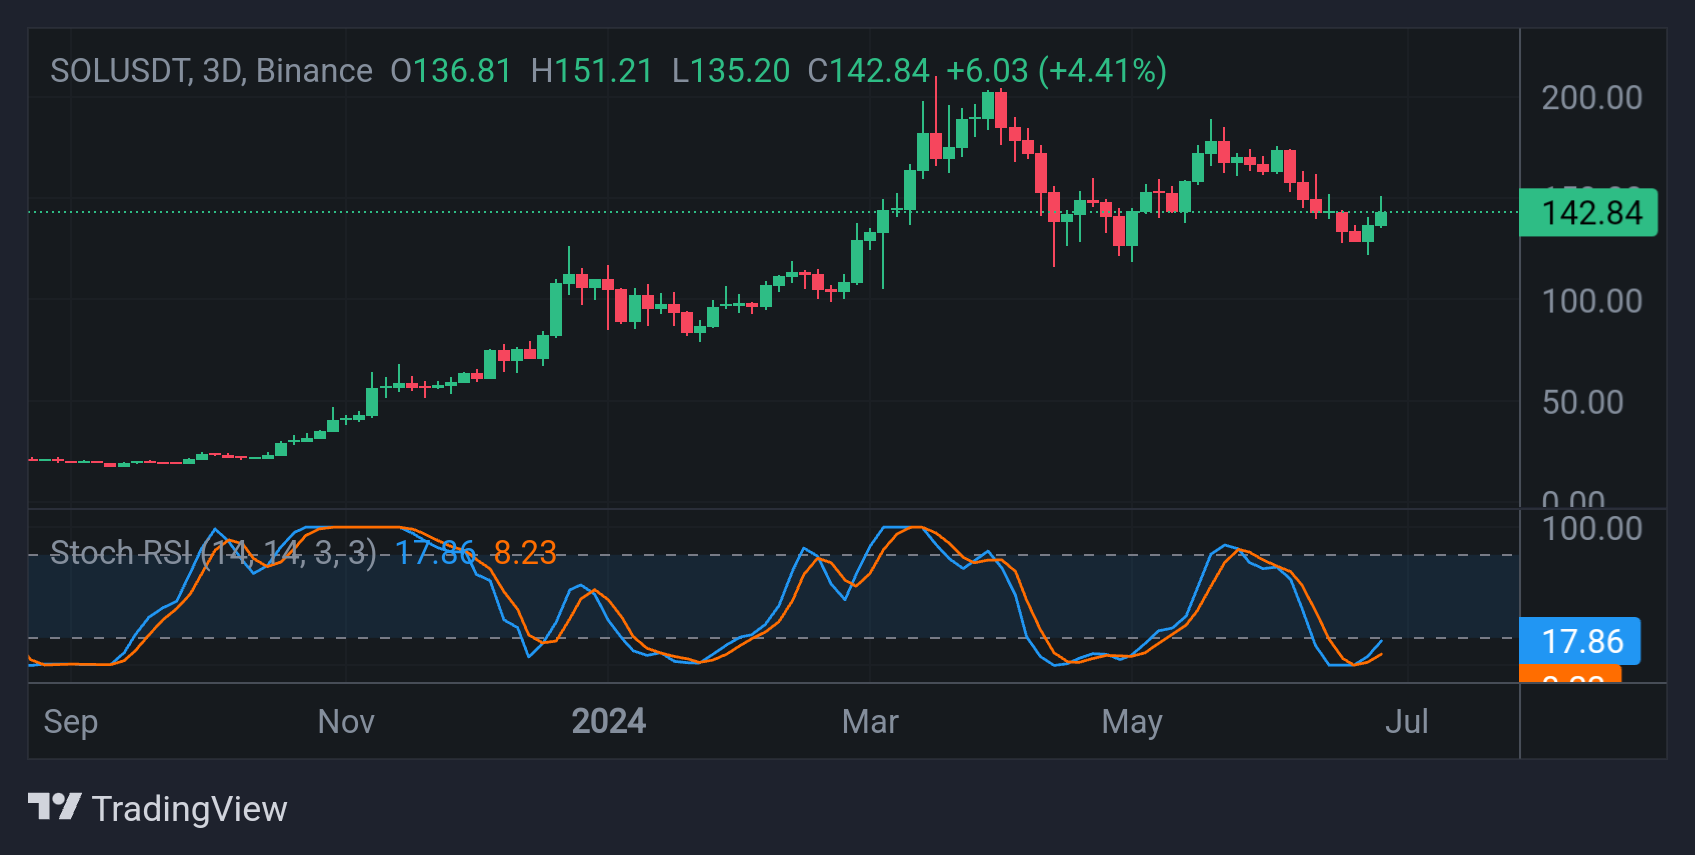 Stochastic RSI indicator "TV"
 The Stochastic RSI indicator, applied on a 3-day chart, shows that it is moving out of the oversold territory. Here, the %K line—the blue one—crosses from below the %D line, the orange, at 17.86 and 8.23, respectively.
This is mostly considered a bullish reversal. If price action sustains, there will be a higher probability of upside with this indicator in the oversold condition.
Ultimately, multiple time frame analysis on SOLUSDT yields mixed sentiment. The 4-hour chart indicates a bearish trend in the short term, with a possible support at $140. On the daily chart, that would be a slight recovery to the upside but still has stiff resistance at $150. On the 3-day chart, it would indicate a possible ending of the correction phase—the start of a bullish reversal, especially with the Stochastic RSI supporting this.
The $150 resistance level should be the key watch for traders. If it breaks higher, then that would confirm a bullish bias, but failure to do so might see further consolidation or eventually a drop toward lower support levels.
Note : This post is made for educational purpose and not a financial advice.
Kind Regards
@artist1111

May the winds of fortune
carry you to greatness!