|
 Canvas Edit
Greetings to everyone in Steem Alliance and others visitors. This is me @artist1111 once again . Today, I am once again going to discuss the market sentiments by understanding the price action of SOL across different time frames and closely take a look by volume which makes idea clear.
I am pretty sure that this analysis will provide pretty good highlight the current ETH/USDT market sentiment on 30/06/2024 and potential future movements.
Let's don't wait, jump in by first looking at the 4 hours , then daily time frame , after that 3 day , then finally take a look of , and finally look at Stochastic RSI indicator for more solid overview as i use it almost for my trading journey.
|
 TradingView
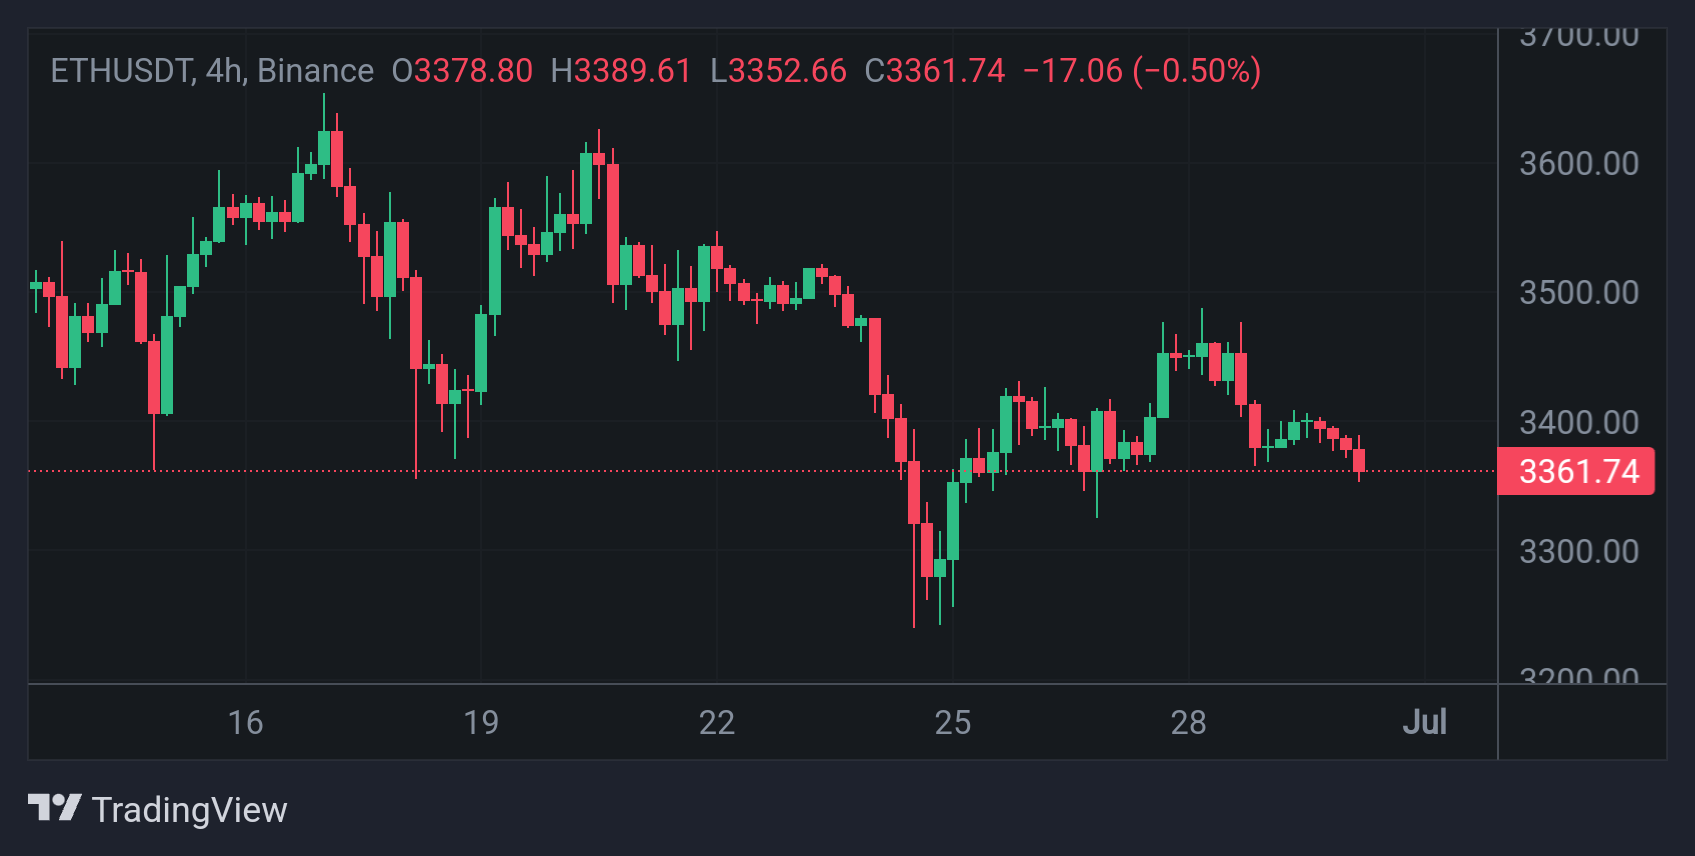
First of all, I opened the 4-hour time frame chart of the ETH/USDT pair. At this moment, the current price we see is 3361.74.
In this chart, we can see there was a recent drop after hitting a high of 3389.61 on the 28th. The short-term sentiment can turn bearish due to this downward movement. Before this drop, the price had moved sideways, showing indecision in the market.
The steep drop, however, indicates that sellers are in charge, albeit temporary. If this weakness persists, we may have a test of the support levels coming in at 3300.
|
 TradingView
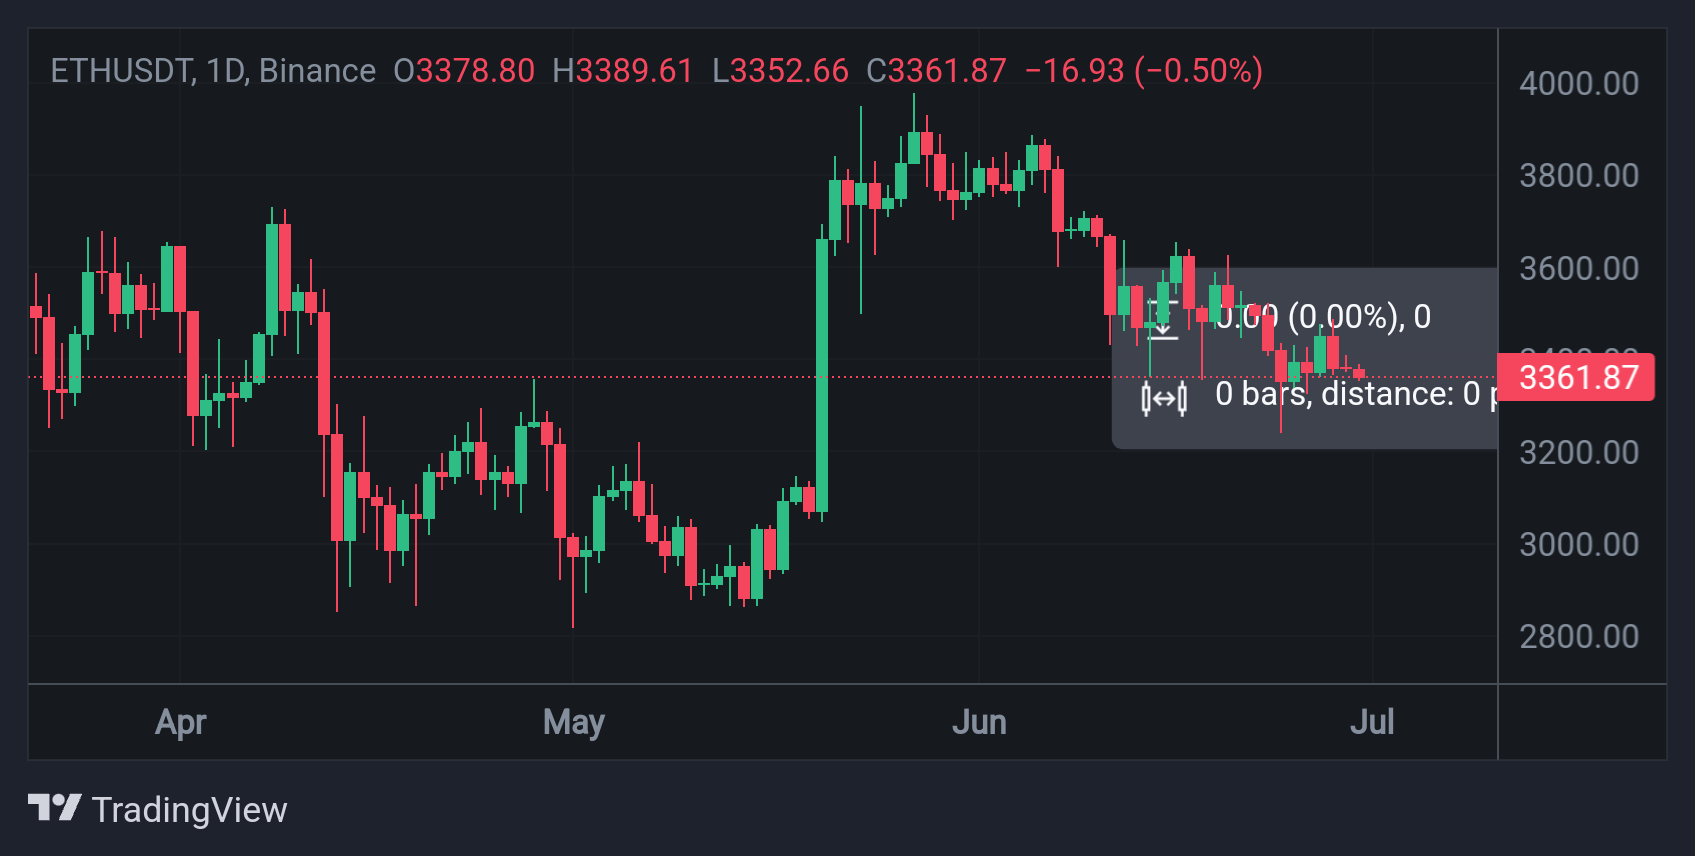
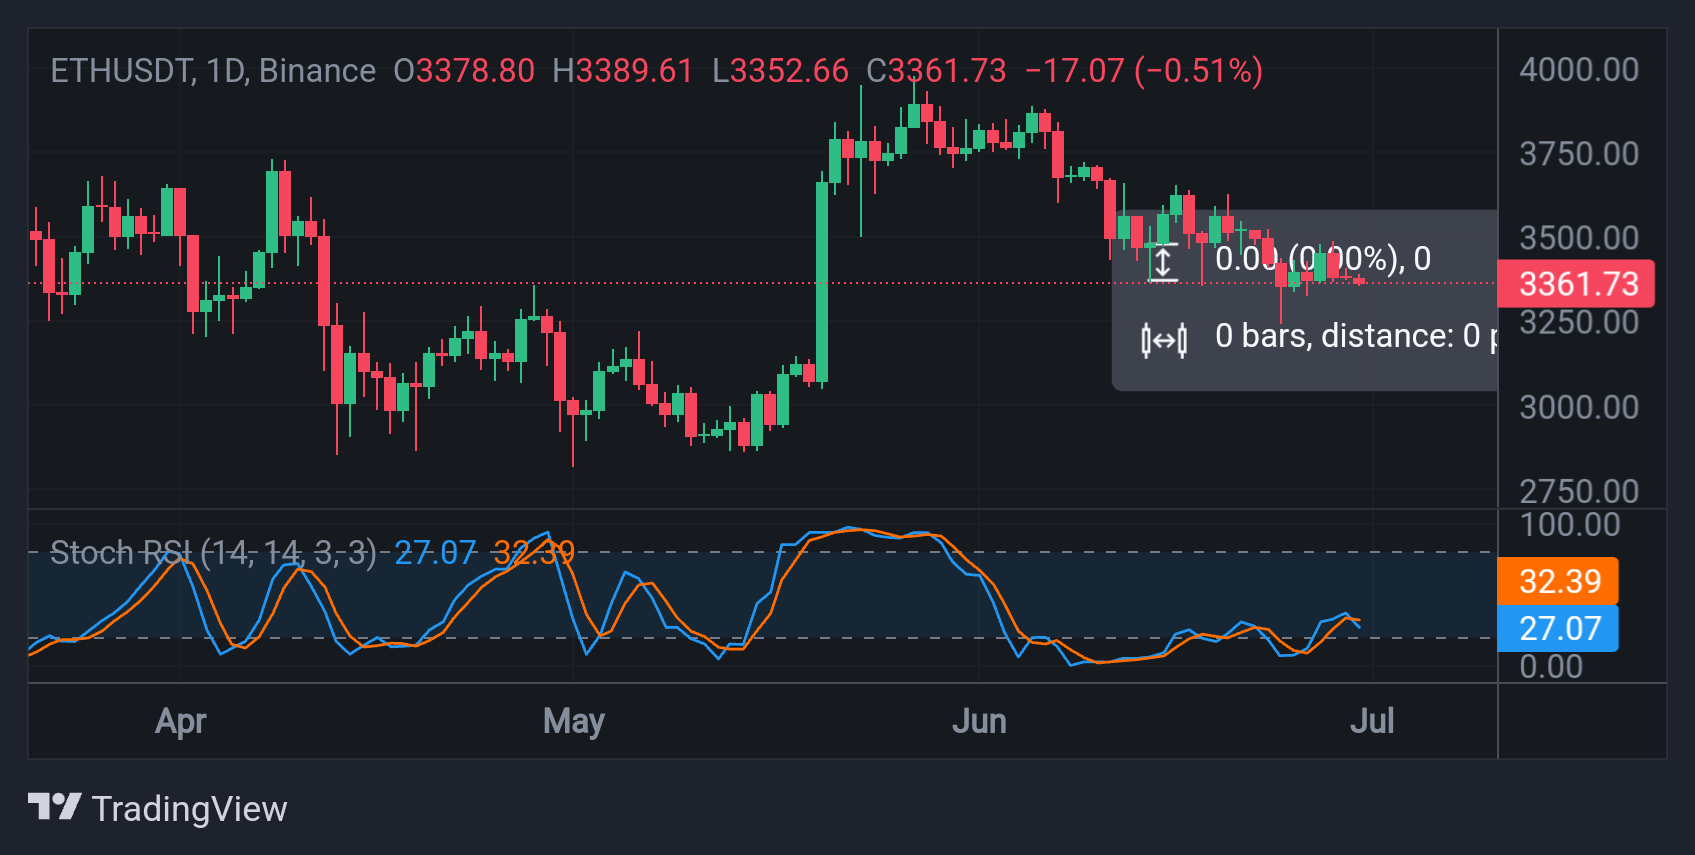
 I then turned to the daily timeframe. As of now, the price is 3361.87. We can also notice this bearish trend on the daily chart. The price achieved a high of 3889.61 towards the beginning of June and has since given way.
This longer-term downtrend reinforces the bearish sentiment in the 4-hour chart quite strongly. The daily candles define very damning characteristics for a downtrend: lower highs and lower lows.
If this continues, further drops could be staged in price action. An important level of support here would be around 3200, whereby price would attract some purchase interest.
|
 TradingView
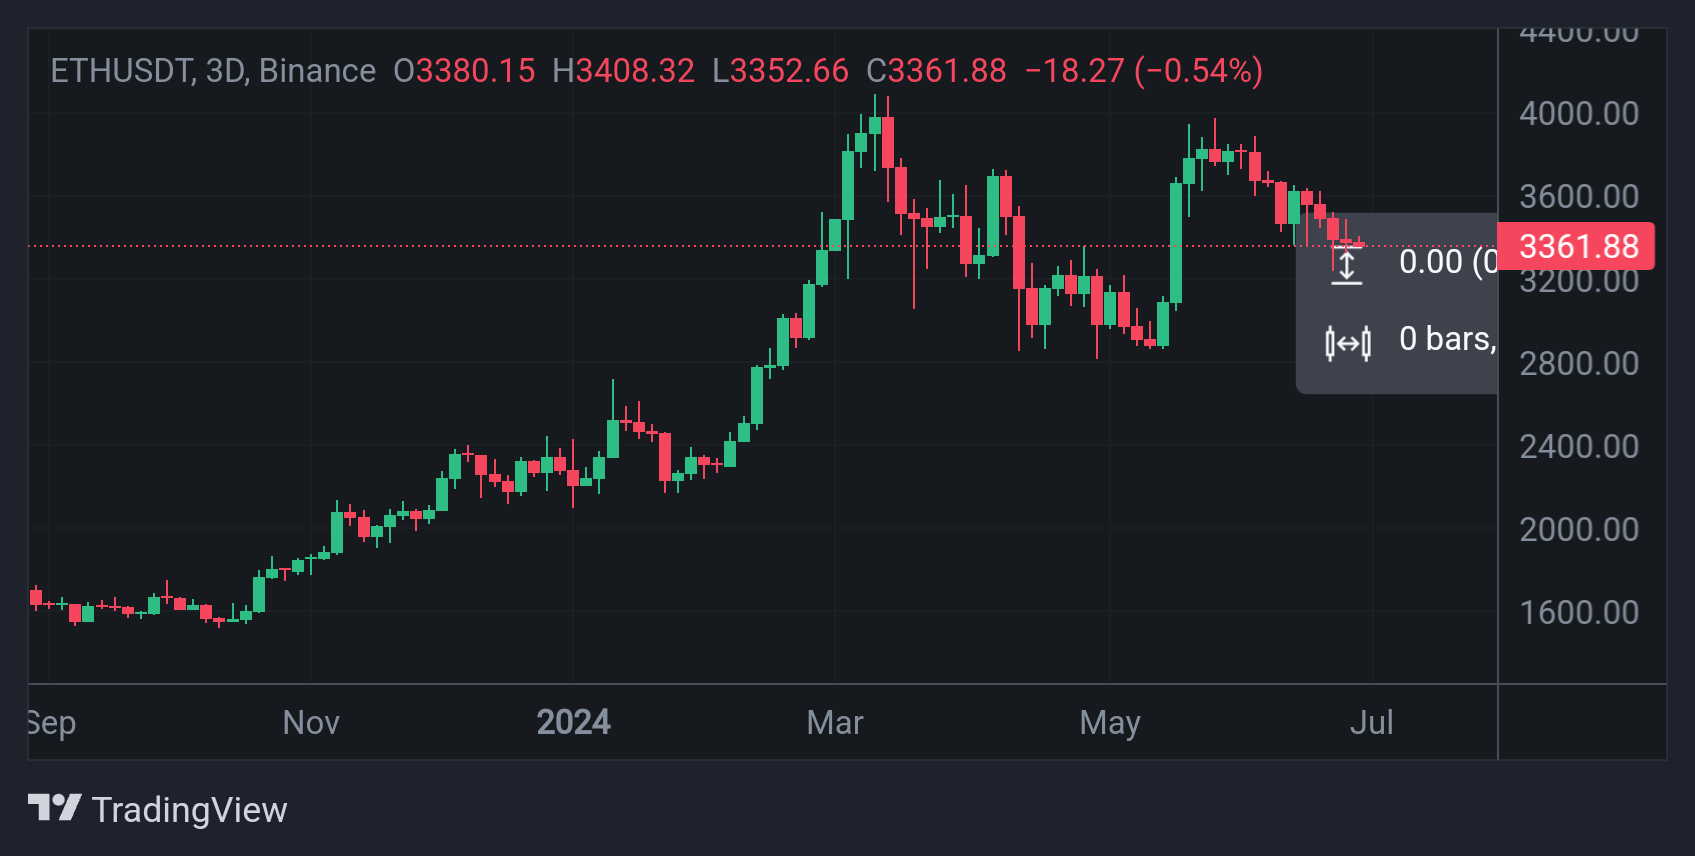
 Finally, I checked the chart on a 3-day time frame. The current price is 3361.88. This chart gives a wider perspective, showing that the price had rallied from about 1000 by late 2023 to almost crossing over 4000 by mid-2024.
However, since hitting the peak, the price has been in a correction phase. Recent candles of this chart shown a bearish trend similar to the daily chart indicating the long-term uptrend might be pausing or revering.
This larger time frame indicates the market might be in consolidation after this huge rally, possibly setting up either for a more minor continuation of the uptrend or a more meaningful correction.
|
 TradingView
 Using the Stochastic RSI indicator on this analysis, we get even more insight. On the 3-day chart, the Stochastic RSI comes in with a reading of 27.07 and 32.39, respectively, as the market nears oversold territory.
This could prescribe that the downside trend is weakening and may lead to a near-term reversal or at least some kind of bounce. On the daily chart, we get similar Stochastic RSI readings that further support this view.
If the Stochastic RSI crosses above 20 from the oversold zone, that could turn out to be a strong signal for a bullish reversal.
The ETH/USDT pair is clearly in a bearish sentiment in both the short and day charts, where prices are making lower highs and lower lows. The 3-day chart shows a longer-term correction phase off a large rally. However, the Stochastic RSI says the market is nearing oversold conditions, which can result in a bounce or turn around.
Traders should look to see a confirmation of a bullish reversal before considering long positions. For now, it remains bearish, but a shift could be in the cards if these oversold signals play out.
Note : This post is made for educational purpose and not a financial advice.
Kind Regards
@artist1111

May the winds of fortune
carry you to greatness!