Arbitrum emerges as a Layer 2 scaling solution for the Ethereum blockchain, leveraging optimistic rollups to bundle multiple transactions into a single one, significantly enhancing transaction throughput and reducing fees. This innovative approach enables the seamless deployment of Ethereum DApps without code modifications, while facilitating thousands of transactions per second at minimal cost. Additionally, Arbitrum supports a variety of popular programming languages, including Rust, C++, and more, empowering developers to build and deploy their applications with ease. Users benefit from faster and cheaper transactions while retaining the security and decentralization advantages of the Ethereum network.
ARB Token: A Gateway to Governance and Ecosystem Growth
ARB stands as the native and governance token of the Arbitrum ecosystem. Launched during the 2021 bear market, ARB has exhibited remarkable resilience and upward momentum. On the monthly chart, ARB recently touched an all-time high of approximately $2.41, establishing a strong support level at $0.73.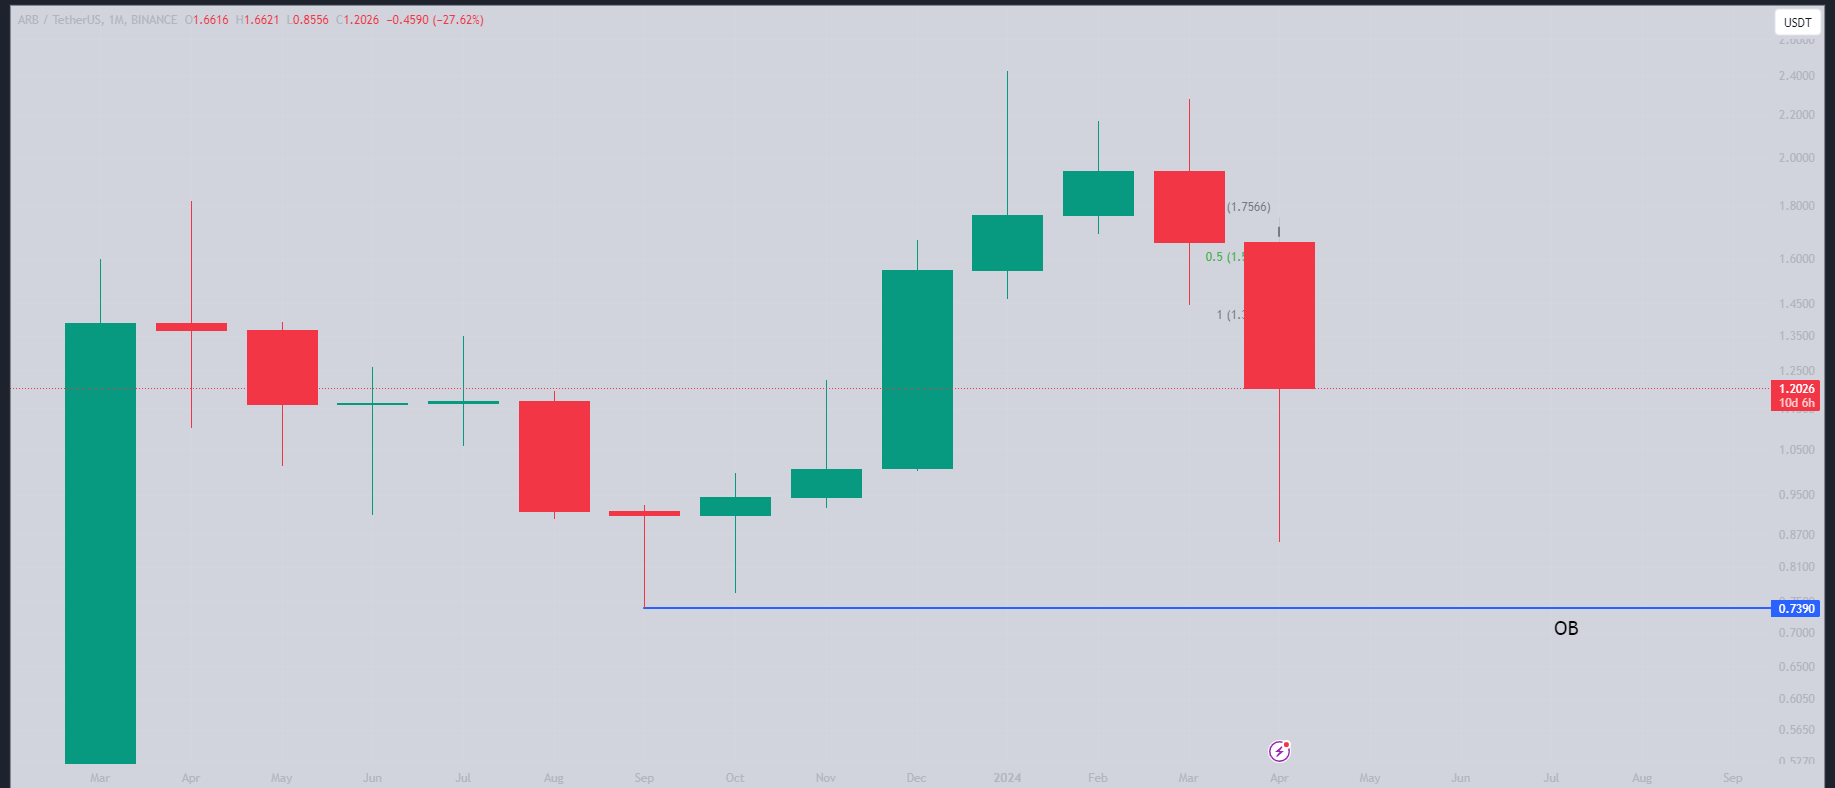
Technical Analysis: Unveiling Price Trends and Potential Targets
Weekly Chart: Bearish Correction and Potential Rebound
The weekly chart reveals a bearish sentiment over the past few weeks. However, a strong correction last week brought the price down to $0.85, effectively filling the lower imbalance zone and potentially signaling a shift in market structure. This weekend will be crucial in determining whether the market continues its bearish trend or embarks on a bullish reversal. In the long term, a 5x increase from current levels remains a viable expectation.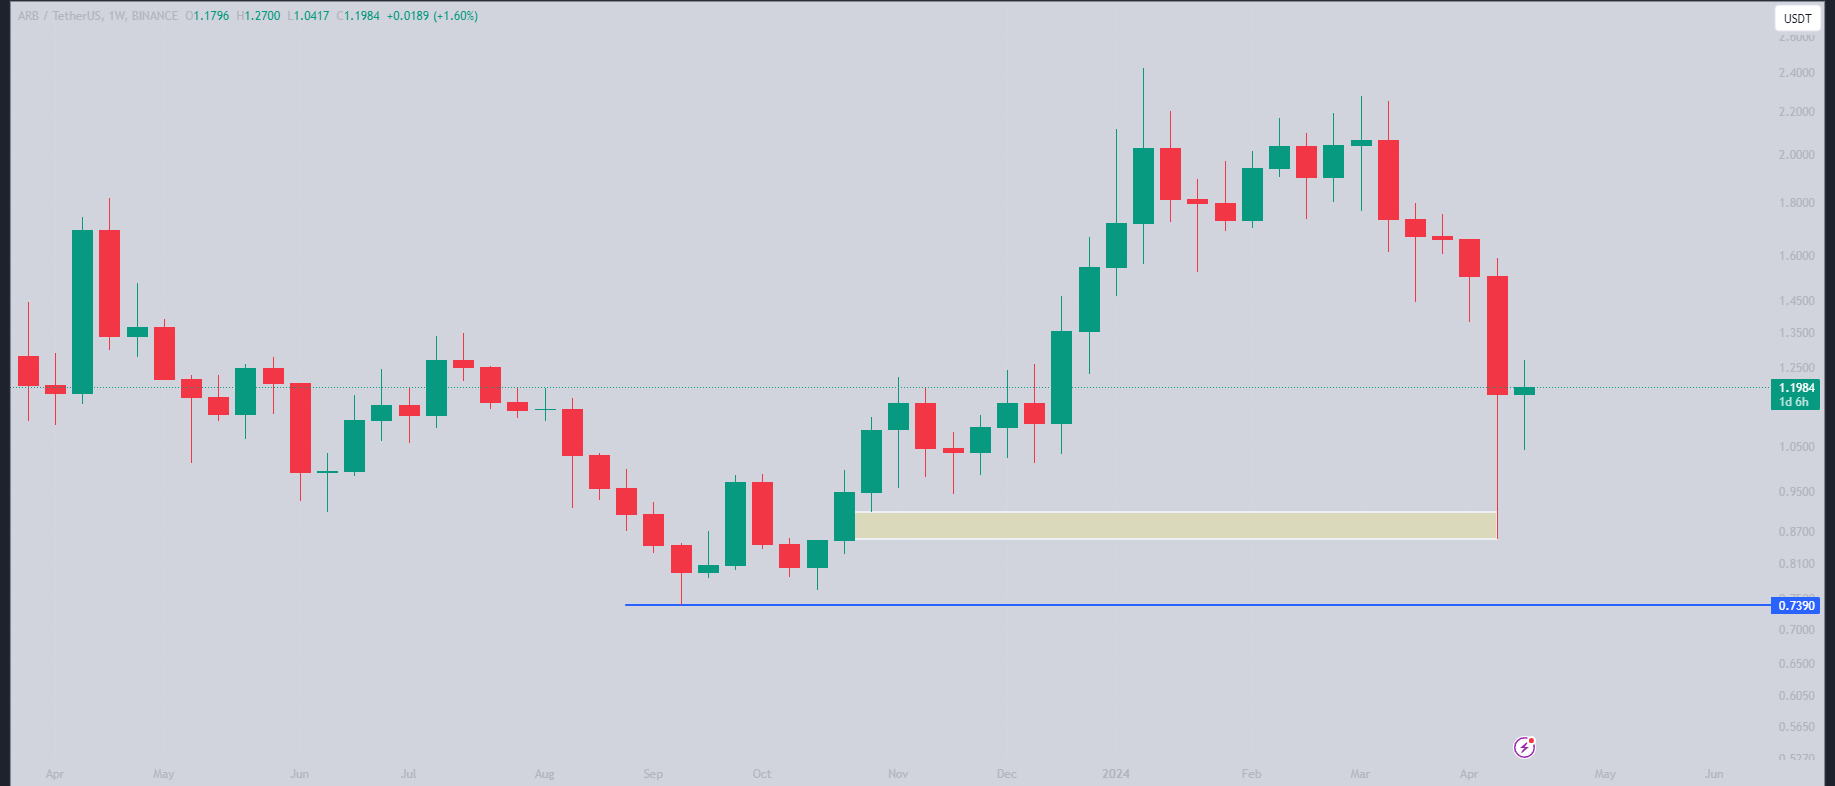
Daily Chart: Ranging Structure and Potential Breakout
The daily chart presents a ranging structure with a range high of $1.1926 and a range low of $1.028. A decisive breakout above the $1.27 level, accompanied by a strong candle, could trigger a significant upward move, potentially reaching $1.41. Subsequent price targets include $1.66, where significant liquidity resides, and $1.78, a potential deviation level that could lead to a new all-time high.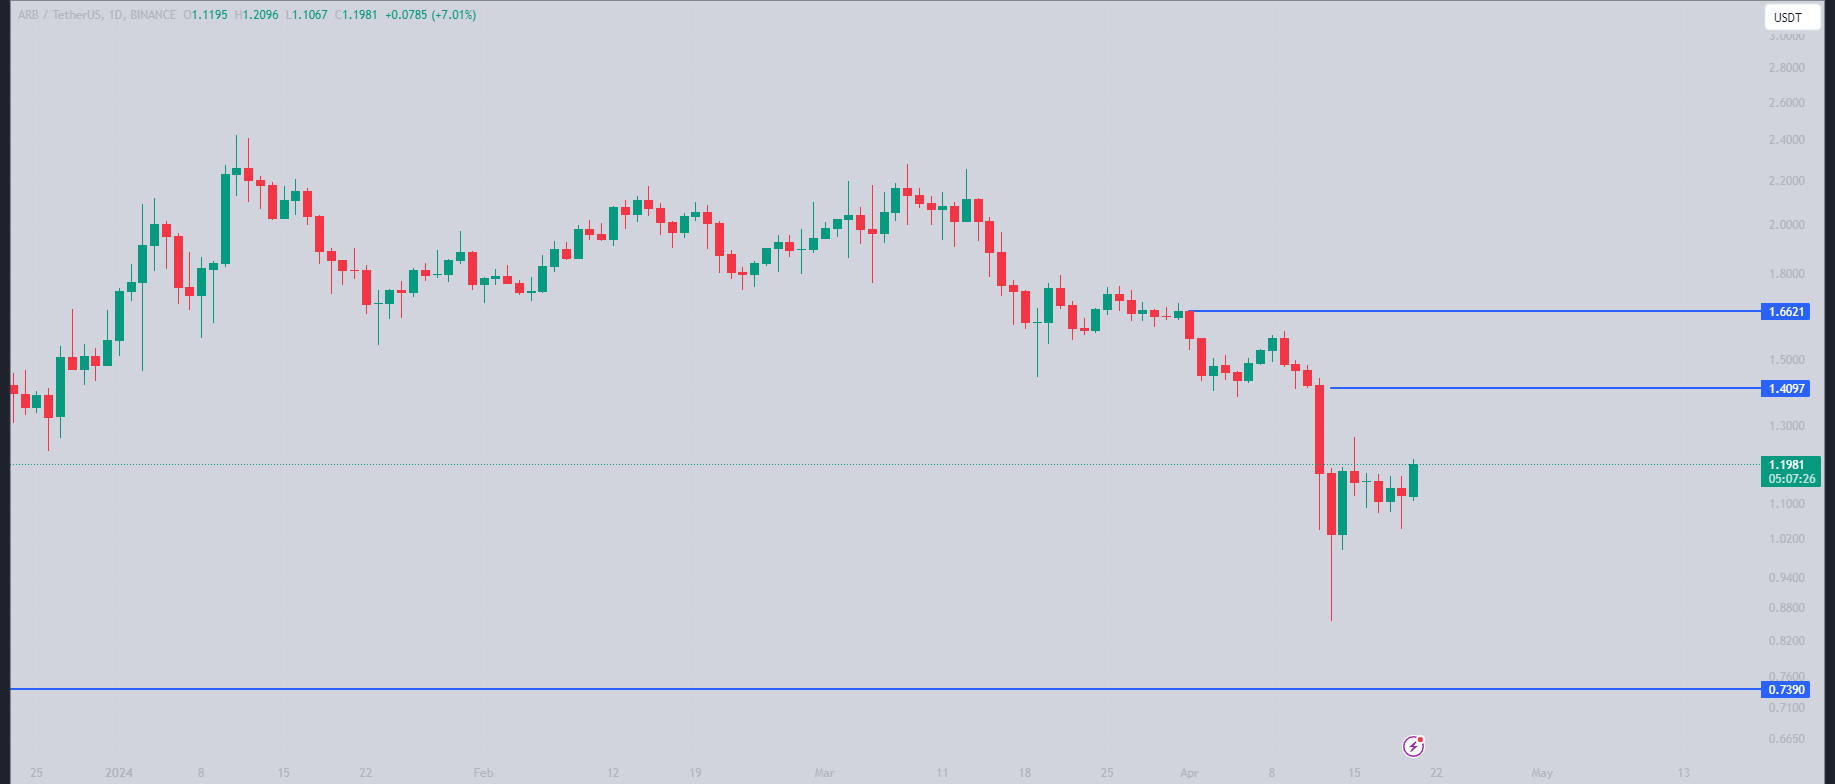
4-hour Chart: Scalping Strategies and Potential Entry/Exit Points
For scalping opportunities, the 4-hour chart indicates a current spot price of $1.20. A breakout above $1.26 could serve as an entry point, with an exit target at $1.40 for a 10% profit. Conversely, a bearish shift below $1.20 could present an entry point at $1.12, given the presence of liquidity in both areas. A stop-loss order should be placed at $1.01 for risk management.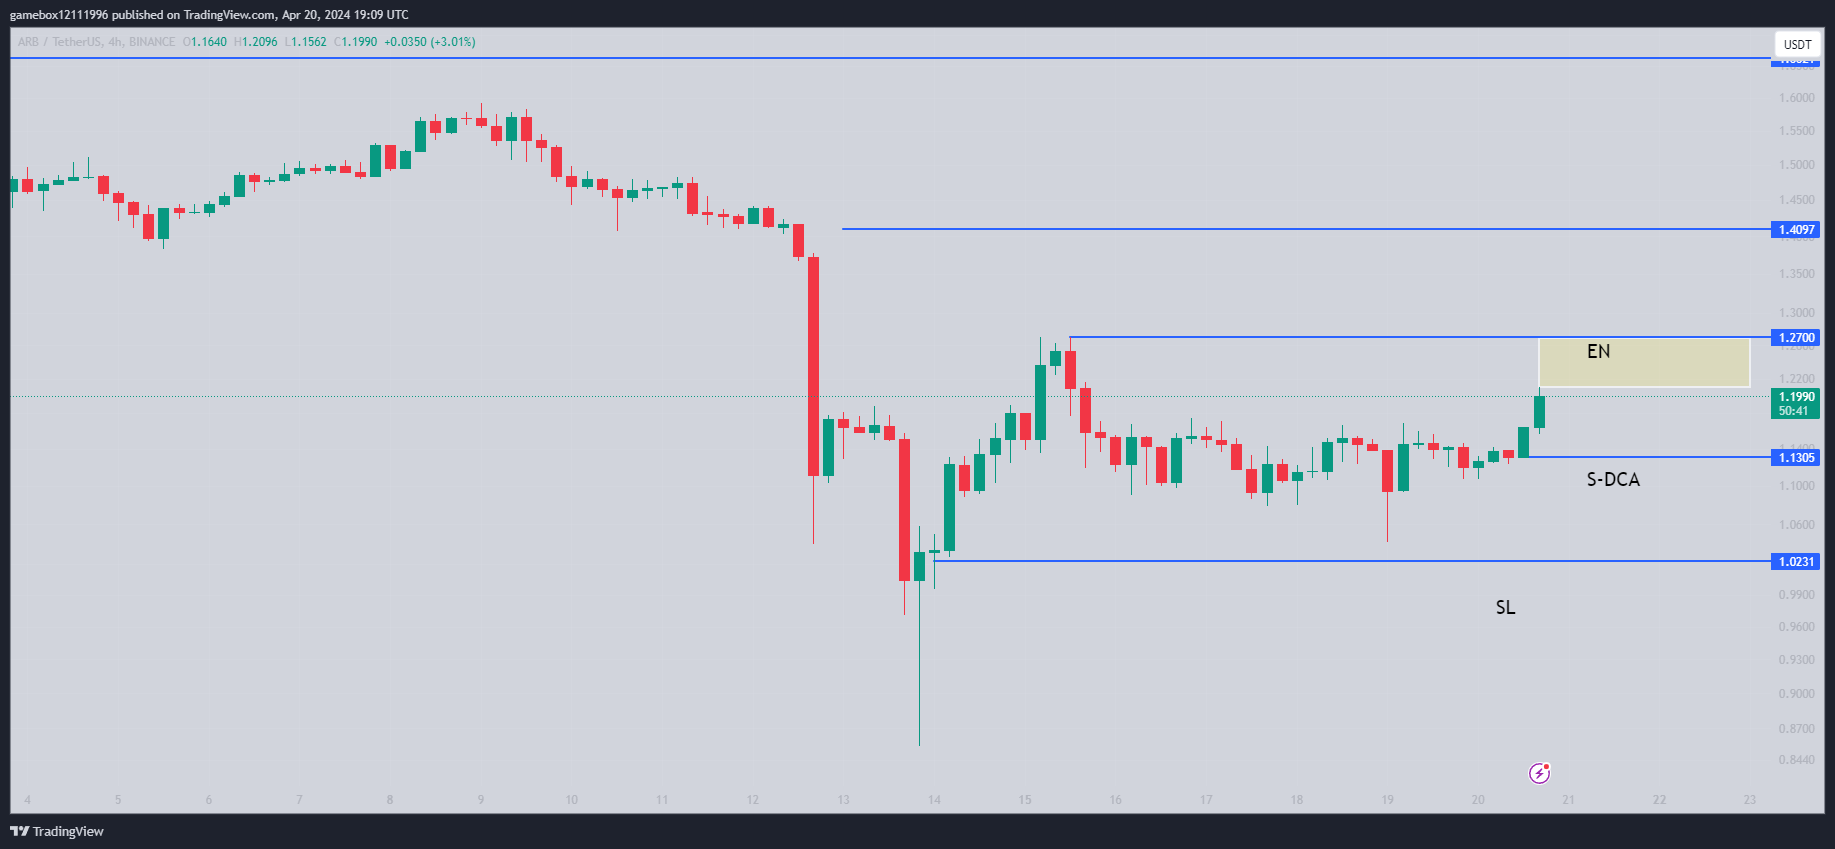
Disclaimer
It is crucial to emphasize that this analysis is solely intended for educational purposes and does not constitute financial advice. Any investment decisions based on this information are at your own discretion and risk.