DYDX stands out as a decentralized exchange (DEX) built on the Ethereum blockchain. Initially launched as a Layer Zero protocol, it subsequently transitioned to Layer Two to minimize trading fees and enhance user experience. Currently, DYDX holds the 86th position in the cryptocurrency market rankings.
Monthly Chart: Substantial Correction and Potential Breakout
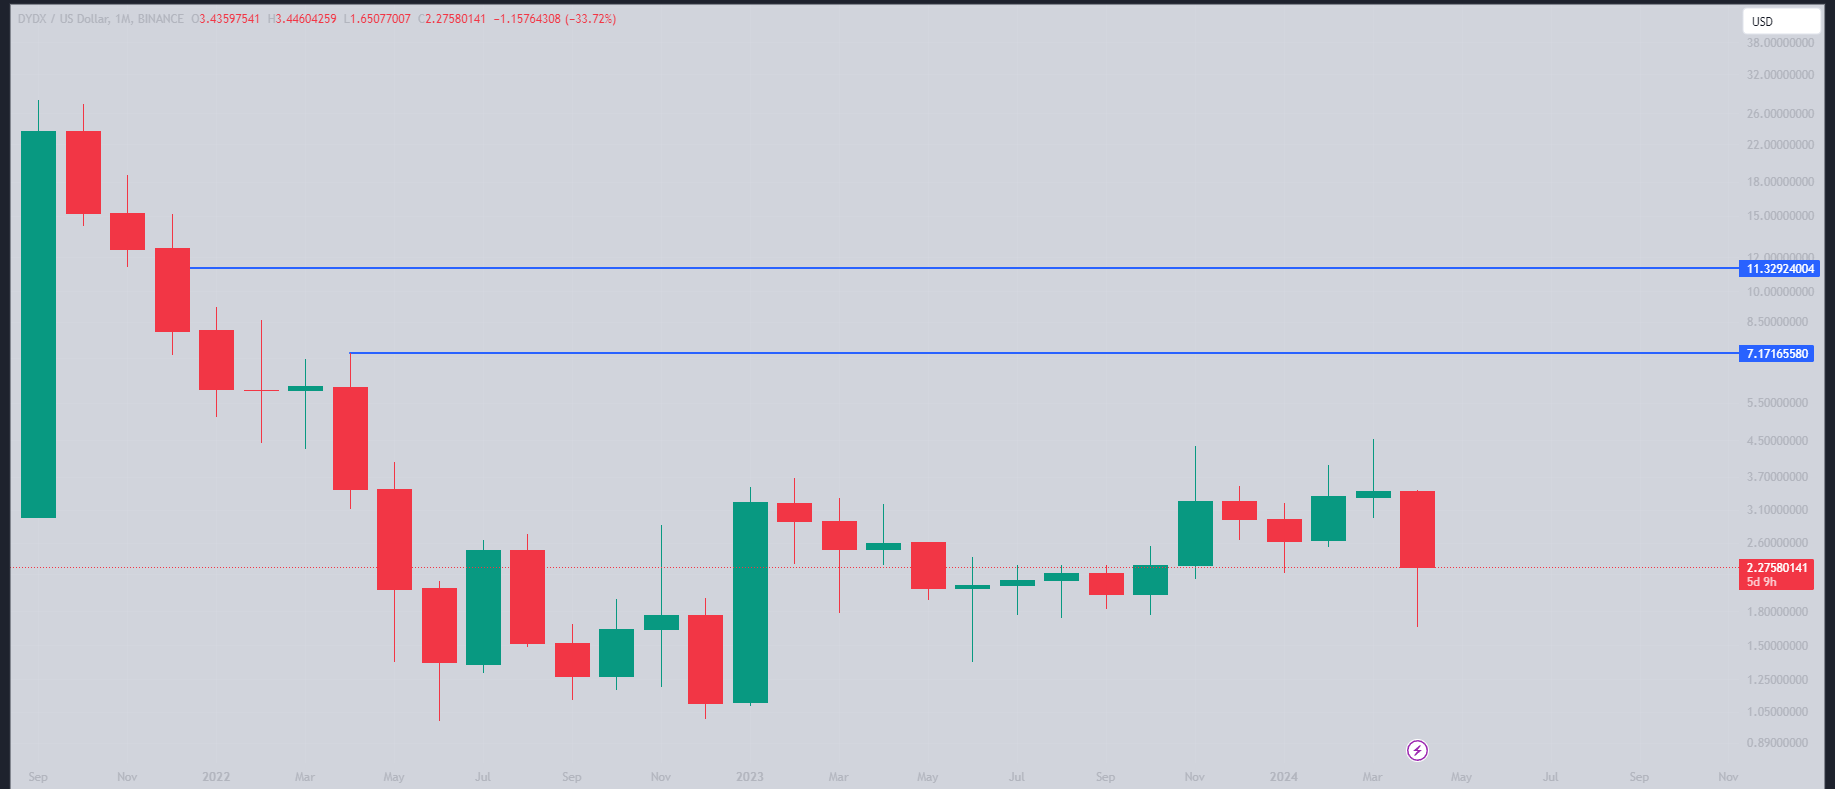
The monthly chart reveals a recent substantial correction, indicating a shift in market structure from an accumulation zone to a manipulation zone. Over the past few months, price action had been confined within a range between $2.09 and $4.364. However, the price broke through this range and experienced a downward correction.
Weekly Chart: Price Direction Awaiting Confirmation
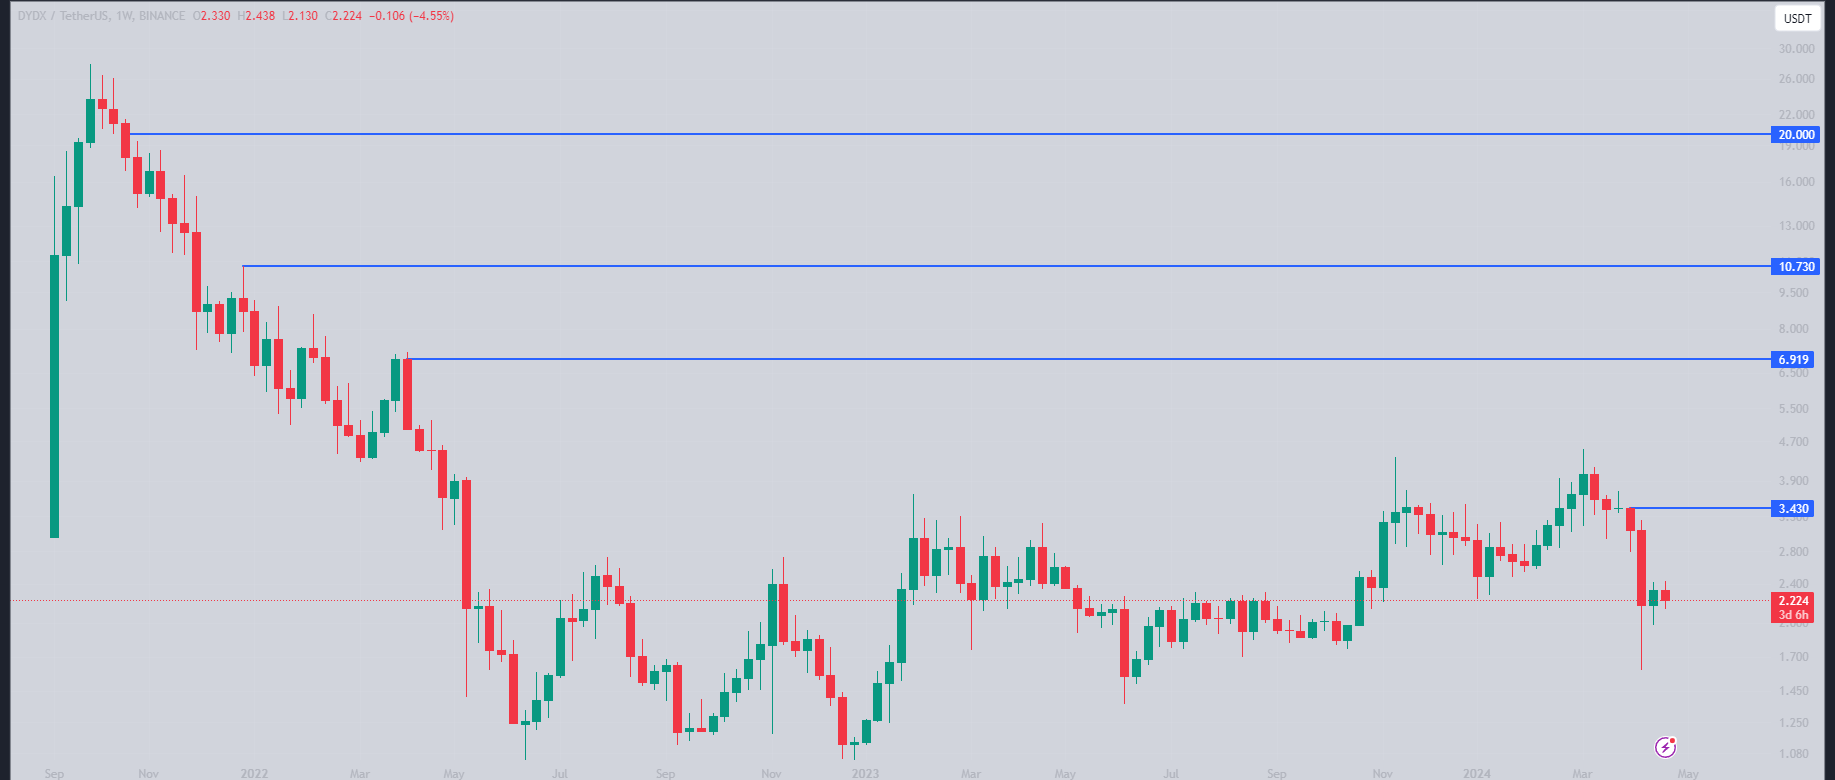
The weekly chart suggests that price direction is yet to be confirmed. Over the past two weeks, low volume has resulted in the formation of two bearish candlesticks within a price range of $2.167 to $2.33. The upcoming weekend could provide clarity regarding the price direction. In the longer term, a price target of $20 is anticipated.
Daily Chart: Market Structure Shift and Potential Upside Move
The daily time frame presents a shift in market structure. Currently trading at $2.213, the price has already absorbed liquidity from $2.135 and is forming bullish candlesticks. If the price breaks through the current structure, an upward movement towards $3.196 is possible within the week.
Disclaimer
It is crucial to emphasize that this analysis is solely intended for educational purposes and does not constitute financial advice. Any investment decisions based on this information are at your own discretion and risk.